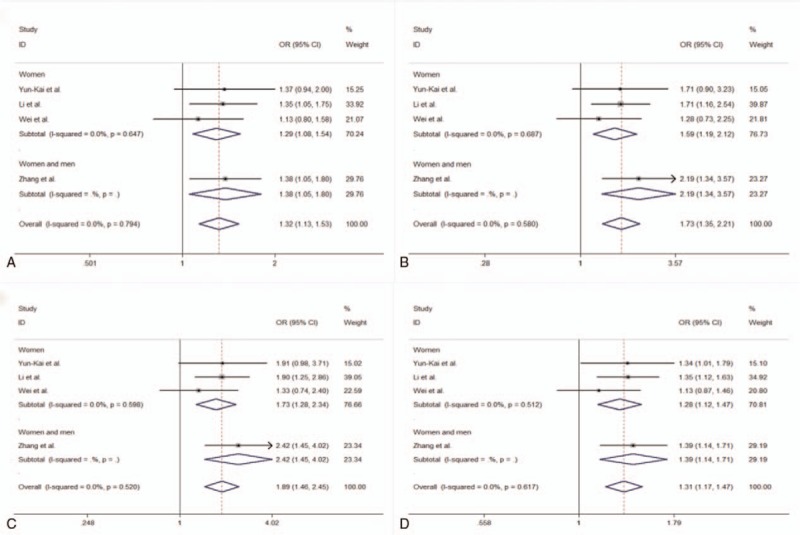
Figure 2.

Forest plots showing meta-analysis of the association between rs35767 and osteoporosis risk. A, Meta-analysis of the association between rs35767 and osteoporosis risk under dominant model (TT + CT vs CC). B, Meta-analysis of the association between rs35767 and osteoporosis risk under recessive model (TT vs CT + CC). C, Meta-analysis of the association between rs35767 and osteoporosis risk under homozygote model (TT vs CC). D, Meta-analysis of the association between rs35767 and osteoporosis risk under allelic model (T allele vs C allele).
