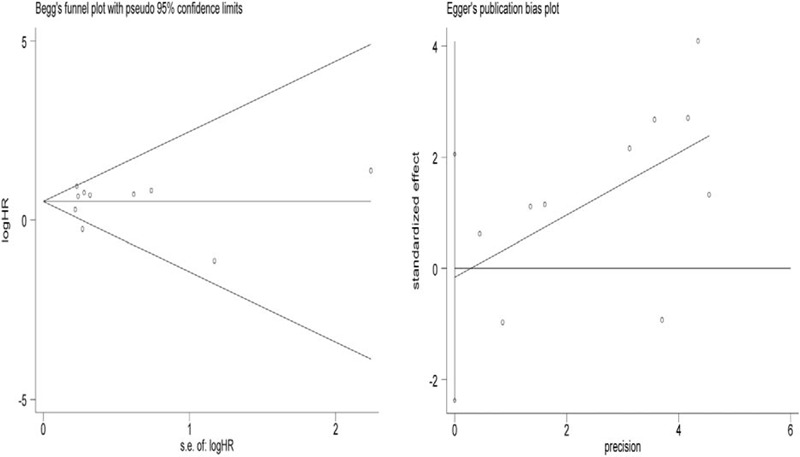
Figure 5.

Publication bias analyses. (A) Begg's funnel plot test and (B) Egger's linear regression test were conducted to assess potential publication bias on the reported association between lncRNAs expression and BRFS in PCa. Log[HR] = natural logarithm of HR; the horizontal lines represent the magnitude of the effect. Each point represents a separate study. BRFS = biochemical recurrence free survival, HR = hazard ratios, lncRNAs = long noncoding RNAs.
