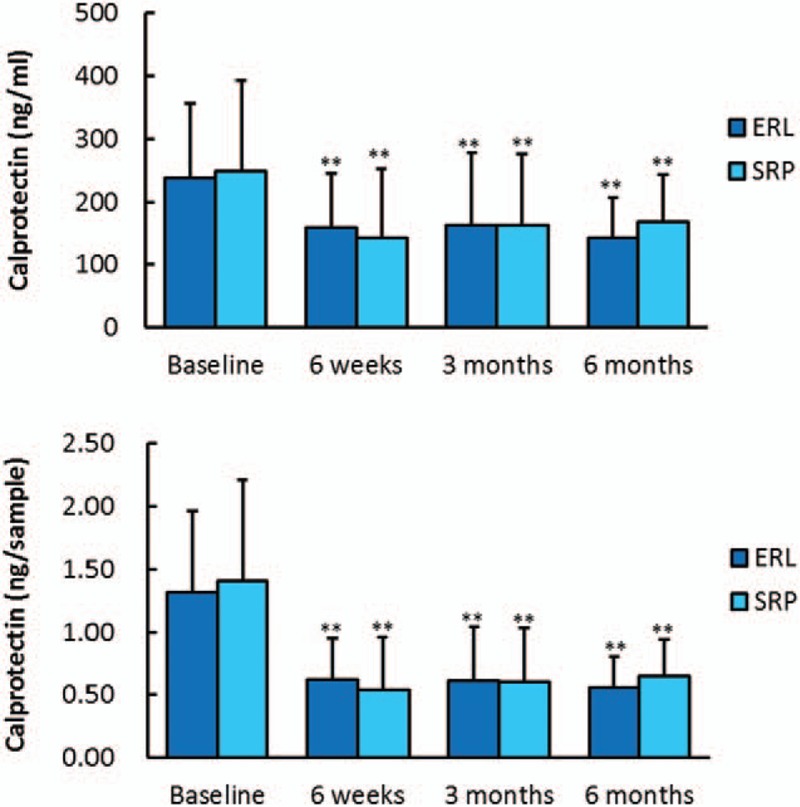
Figure 3.

Concentration of calprotectin (ng/mL) and total amount of calprotectin (ng/sample) from baseline to 6 months in the 2 groups. (∗∗) Indicates significance (P < .01) compared with baseline. Er:YAG = Er:YAG laser group, SRP = combination of ultrasonic and manual scaling and root planing group.
