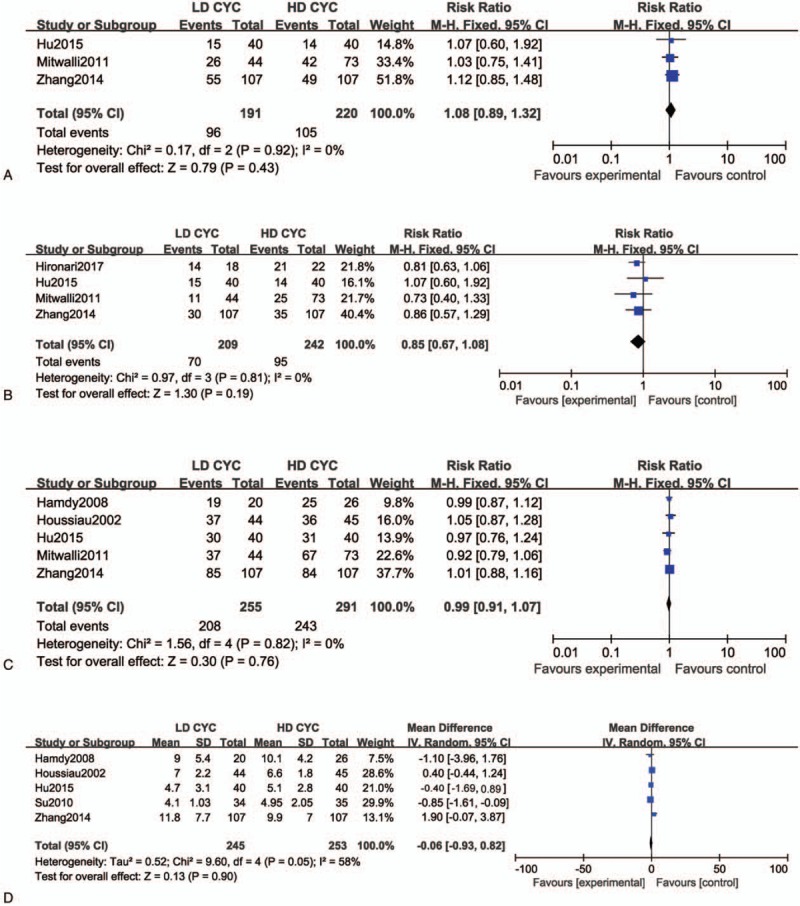
Figure 3.

Forest plot of risk ratio (RR) and 95% confidence intervals (CIs) of evaluated efficacy of different cyclophosphamide (CTX) doses for treatment of lupus nephritis (LN). (A) Partial, (B) complete, and (C) total remission rates. (D) Systemic lupus erythematosus disease activity index (SLEDAI). Squares represent the RR of each study, and the area of each square was proportional to the weight of each study in the meta-analysis; horizontal lines, 95% CIs; closed diamond, pooled RR with their 95% CIs.
