
. 2017 Dec 22;96(51):e9413. doi: 10.1097/MD.0000000000009413
Copyright © 2017 the Author(s). Published by Wolters Kluwer Health, Inc.
This is an open access article distributed under the Creative Commons Attribution License 4.0 (CCBY), which permits unrestricted use, distribution, and reproduction in any medium, provided the original work is properly cited. http://creativecommons.org/licenses/by/4.0
Figure 6.
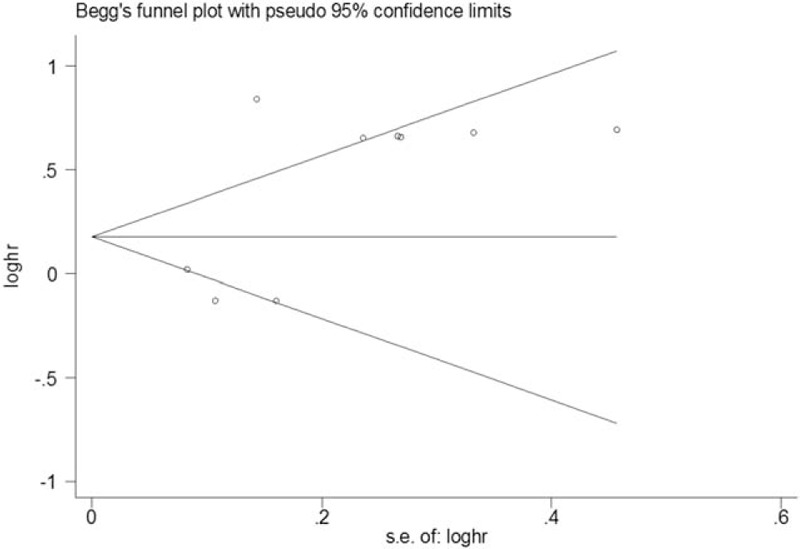
Begg funnel plot of studies in the general population.