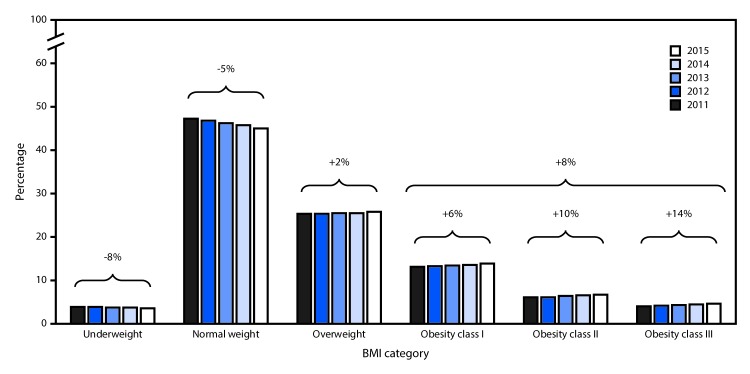
FIGURE.
Prevalences and relative changes in prepregnancy BMI categories* among women with a live birth — 36 states, District of Columbia, and New York City,† 2011–2015
Abbreviation: BMI = body mass index (kg/m2).
* Prepregnancy BMI was categorized as underweight (BMI <18.5), normal weight (BMI 18.5–24.9), overweight (BMI 25.0–29.9), obesity class I (BMI 30.0–34.9), obesity class II (BMI 35.0–39.9), and obesity class III (BMI ≥40.0).
† Data are from 38 jurisdictions that utilized the revised birth certificate by January 1, 2011 and, thus, had prepregnancy BMI data during 2011–2015. Jurisdictions included are California, Colorado, Delaware, District of Columbia, Florida, Georgia, Idaho, Illinois, Indiana, Iowa, Kansas, Kentucky, Louisiana, Maryland, Michigan, Missouri, Montana, Nebraska, Nevada, New Hampshire, New Mexico, New York, New York City, North Carolina, North Dakota, Ohio, Oklahoma, Oregon, Pennsylvania, South Carolina, South Dakota, Tennessee, Texas, Utah, Vermont, Washington, Wisconsin, and Wyoming (natality data from New York City are reported separately and are not included in New York estimates).

