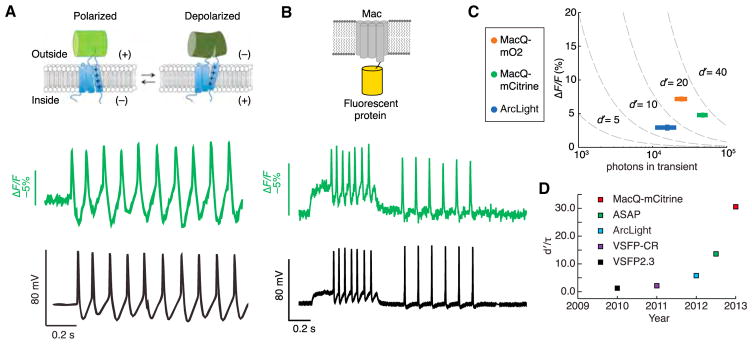
Figure 2. Recent Advances in Genetically Encoded Fluorescent Voltage Indicators.
(A) Upper: Design of the ASAP1 voltage sensor. A circularly permuted green fluorescent protein is inserted within an extracellular loop of the VSD from a chicken voltage-sensitive phosphatase. Depolarization leads to decreased fluorescence. Lower: Simultaneously acquired optical (green) and electrophysiological (black) recordings from a cultured hippocampal neuron expressing ASAP1 and undergoing a spontaneous burst of action potentials.
(B) Upper: Design of a FRET-opsin voltage sensor. An L. maculans (Mac) rhodopsin is fused to a bright fluorescent protein. Lower: Simultaneously acquired optical (green) and electrophysiological recordings (black) from a cultured neuron expressing MacQ-mCitrine.
(C) For a set of measurements performed under standardized optical conditions, peak ΔF/F values are plotted against the total number of photons detected per spike. Dashed lines are isocontours of the spike detection fidelity index d′.
(D) Genetically encoded voltage indicators have notably improved over the past several years. Whereas d′ measures spike detection fidelity for temporally isolated spikes, d′/τ, where τ is the indicator’s decay time-constant, captures the capabilities of sensors with faster off-times to detect spikes within fast spike trains.
(A) is adapted from St-Pierre et al. (2014). (B) and (C) are adapted from Gong et al. (2014). (D) is courtesy of Y. Gong.

