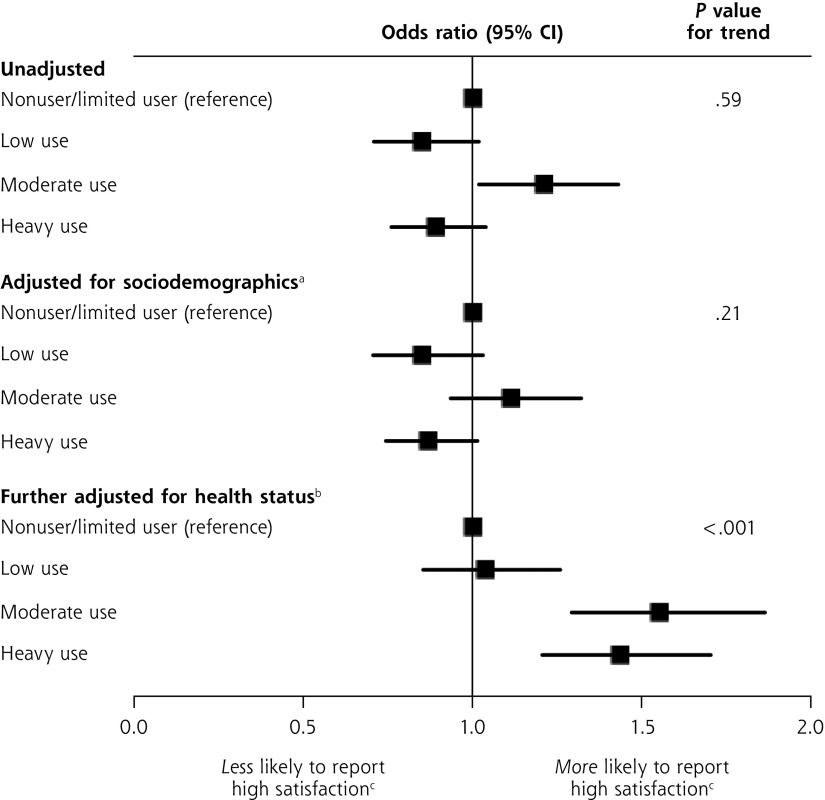
Figure 1.
Odds ratios for the associations between level of prescription opioid use and high satisfaction with care.
Note: Number of prescriptions received in rounds 3 through 5 was used to define nonuse/limited use (0–1), low use (2–4), moderate use (5–9), and heavy use (≥10).
a Adjusted for age (continuous), sex, race/ethnicity (non-Hispanic white, non-Hispanic black, Hispanic vs other).
b Further adjusted for body mass index (continuous), 12-item Short Form Health Survey mental and physical component scores (continuous), self-reported health status (fair or poor vs all others), and self-reported pain level (moderate or severe vs all others).
c High satisfaction was defined as having a composite patient satisfaction score in the highest quartile.

