
Figure 4. Rictor loss decreases growth and Akt S473 phosphorylation in established HER2-amplified breast cancer cells.
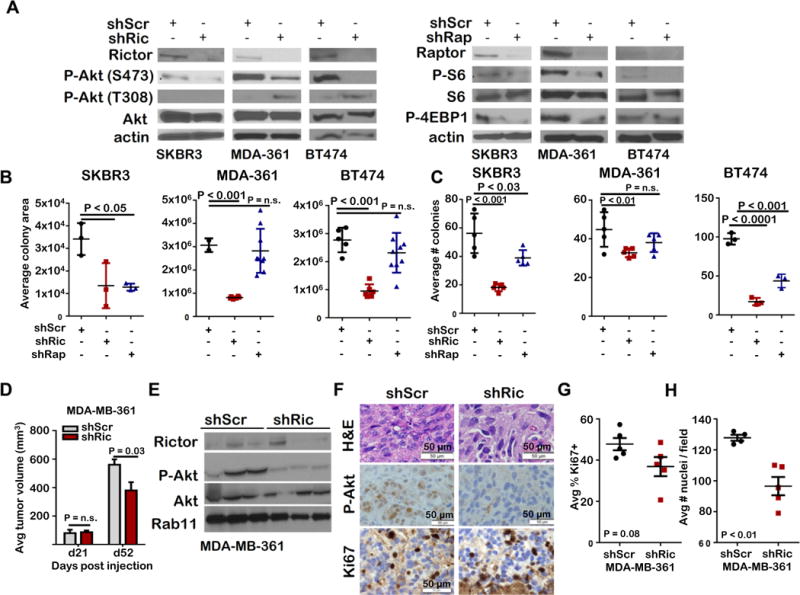
Breast cancer cells expressing shRNA for RICTOR or RPTOR were assessed. A. Whole cell lysates were assessed by western analysis. Representative blots shown. N=3 replicates. B. Cells were cultured 14d, stained with crystal violet, and scanned for fluorescent area using Odyssey. Midlines are average colony area, individual points are the average values obtained for samples assessed in duplicate, N = 3. Student’s T-test. C. Cells were embedded in Matrigel, cultured 14d, imaged, and colonies were counted. Midlines represent average number of colonies, data points represent the average value of duplicate samples. D–G. MDA-MB-361 shControl and shRictor xenografts were assessed. D. Tumors were measured and volume calculated (N = 8). Student’s T-test, P < 0.05. E. Western analysis of whole tumor lysates. Representative images are shown. F. Tumor sections were stained for H&E, P-Akt S473, and Ki67. Representative images are shown. Original magnification = 400X. G. Ki67-positive nuclei were quantitated using Image J. Data points represent the average value of 5 images per tumor, Midlines are average. Error bars are S.D. N = 4–5 tumors. Student’s T-test, P < 0.05. H. Average nuclei per field is shown (midlines). Error bars are S.D. Each data point is average of 5 images/tumor. Student’s T-test, P < 0.05.