
Figure 5. Rictor/mTORC2 signaling drives Akt-mediated survival of HER2-amplified breast cancers.
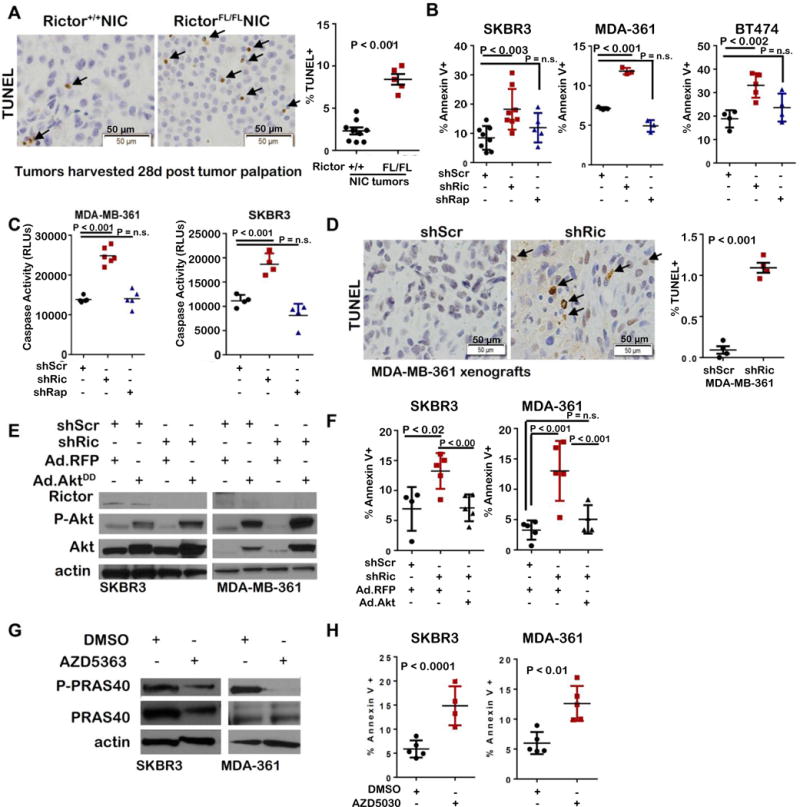
A. IHC for TUNEL positive cells in tumors harvested 28d after tumor palpation. Left panel: Representative images; original magnification, 400X. Right panel: The percentage of TUNEL+ tumor cells was determined. Each datapoint represents the average of 5 fields per tumor. Midline is average per genotype. Error bars are S.D. B. Cells labeled with Annexin V-FITC were imaged. Individual points are average for duplicate replicates. Midlines are average ± S.D. C. Cells were analyzed for caspase 3/7-mediated luminescence. Midlines are the average ± S.D. D. TUNEL analysis of MDA-MB-361 tumor sections. Left panel: Representative images; original magnification, 400X. Right panel: The percentage of TUNEL+ tumor cells was determined. Each datapoint represents the average of 5 fields per tumor. Midline is the average ± S.D. E–F. Cells expressing AktDD or RFP were assessed. E. Western analysis of whole cell lysates. F. Cells labeled with Annexin V-FITC for 6h were imaged. Midlines are the average ± S.D. G–H. Analysis of cells treated with AZD5363 (500 nM) for 24 hrs. G. Western analysis of whole cell lysates. H. Cells labeled with Annexin V-FITC for 6h were imaged. Individual points are average for replicates assessed in duplicate. Midlines are the average ± S.D. Student’s T-test.