
Figure 6. Rictor/mTORC2 loss increases lapatinib-mediated cell killing.
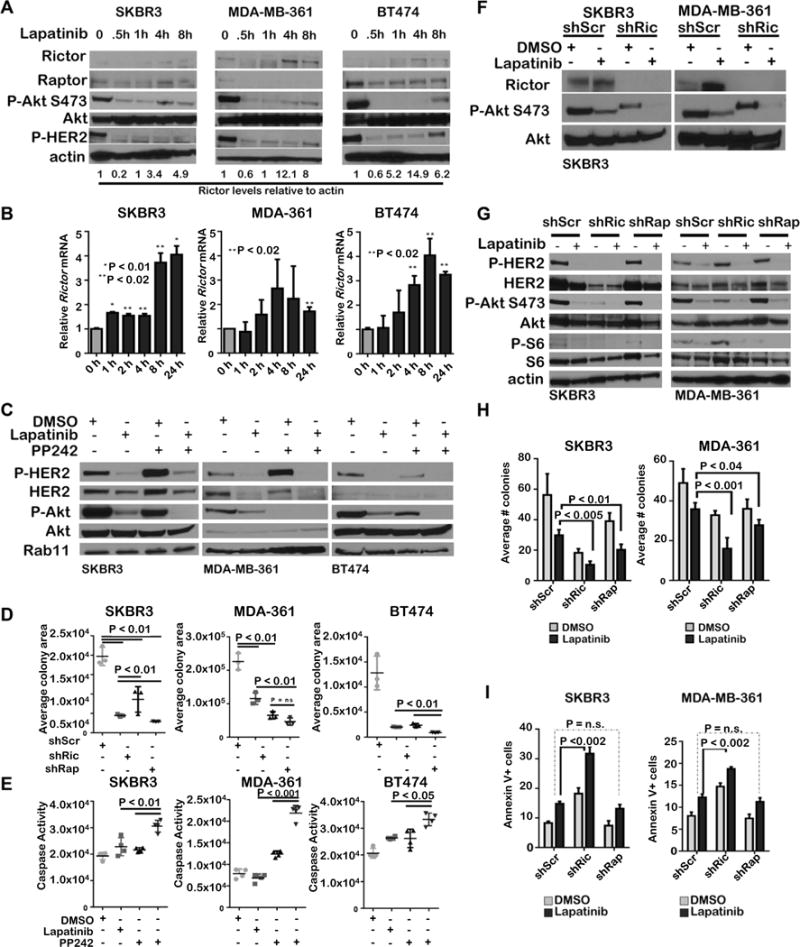
A–B. Cells treated with lapatinib (1uM) were assessed by western blot (A) or qRT PCR (B). N=3 replicates. Student’s T-test. C-E. Cells treated 6h (C and E) or 7 days (D) with PP242 (1 μM) ± lapatinib (1 μM) were analyzed by western analysis (C), for cell density by crystal violet staining (D). or for cell death by luminescent caspase assay (E). Midlines in D and E are the average ± S.D.. Student’s T-test. F-G. Cells treated 6h with PP242 (1 μM) ± lapatinib (1 μM) were analyzed by western analysis. H. Cells embedded in Matrigel were cultured 14d with PP242 (1 μM) ± lapatinib (1 μM) then imaged and colonies were enumerated. Values shown are the average ± S.D., N =3, each assessed in duplicate. I. Annexin V-FITC staining of cells cultured 6h with PP242 (1 μM) ± lapatinib (1 μM) Values shown are the average ± S.D. N = 3.