Figure 5.

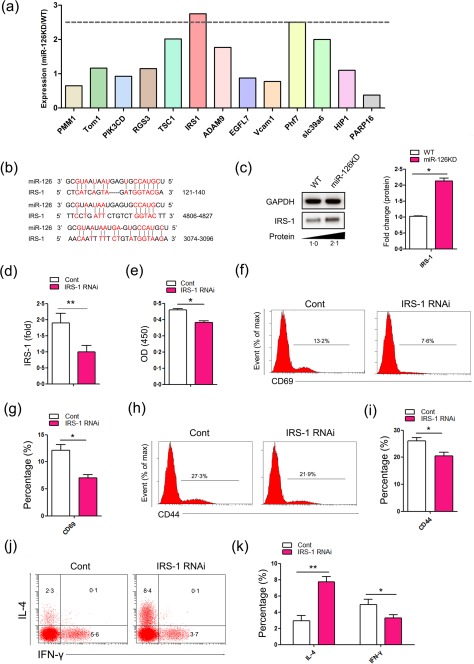
The expression of insulin receptor substrate 1 (IRS‐1) in CD4+ T cells. CD4+CD62L+ T cells were purified by magnetic‐activated cell sorting (MACS) from microRNA‐126 knock‐down (Mir‐126KD) mice and wild‐type (WT) mice (8–10 weeks old, n = 6), respectively. Then, cells were cultured in the presence of anti‐CD3 (20 μg/ml)/anti‐CD28 (4 ng/ml) antibody plus interleukin (IL)‐2 (10 ng/ml) for 48 h. The relative expression of indicated genes, including phosphomannomutase 1 (PMM1), target of Myb1 membrane trafficking protein (Tom1), phosphatidylinositol‐4,5‐bisphosphate 3‐kinase catalytic subunit delta (PIK3CD), regulator of G protein signalling 3 (RGS3), tuberous sclerosis 1 (TSC1), insulin receptor substrate 1 (IRS‐1), ADAM metallopeptidase domain 9 (ADAM9), EGF‐like domain multiple 7 (EGFL7), vascular cell adhesion molecule 1 (VCAM1), PHD finger protein 7 (Phf7), solute carrier family 39 member 6 (SLC39a6), Huntingtin interacting protein 1 (HIP1) and poly(ADP‐ribose) polymerase family member 16 (PARP16P), were analysed by real‐time polymerase chain reaction (RT–PCR) assay and calculated (a). (b) Putative miR‐126‐binding sites in the 3' untranslated region (UTR) of murine IRS‐1. (c) CD4+CD62L+ T cells were purified by MACS from FVB/N6 miR‐126KD mice and WT mice, respectively. Then, cells were cultured in the presence of anti‐CD3 (20 μg/ml)/anti‐CD28 (4 ng/ml) antibody plus interleukin (IL)‐2 (10 ng/ml) for 48 h. The expression of IRS‐1 protein was determined by Western blot and calculated. CD4+CD62L+ T cells were purified by MACS from miR‐126KD mice, Then, cells were transfected with p‐IRS‐1 RNAi (5 ng) and cultured in the presence of anti‐CD3 (20 μg/ml)/anti‐CD28 (4 ng/ml) antibody plus IL‐2 (10 ng/ml) for 48 h. (d) The expression of IRS‐1 was analysed by real‐time polymerase chain reaction (RT–PCR). (e) Call counting kit‐8 assay. The expression levels of CD69 and CD44 were analysed by fluorescence activated cell sorting (FACS) and the percentage was calculated (f–i). (j) The expression levels of interferon (IFN)‐γ and IL‐4 were analysed by FACS and the percentage was calculated (k). One representative example of three independent experiments is shown. *P < 0·05; **P < 0·01. [Colour figure can be viewed at wileyonlinelibrary.com]
