
Figure 4.
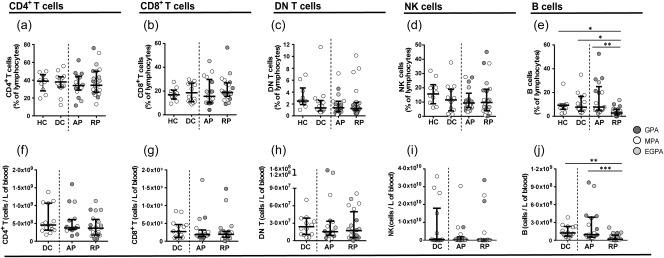
B cell frequencies and numbers are lower in anti‐neutrophil cytoplasm autoantibody (ANCA)‐associated vasculitis (AAV) patients in remission compared to patients with active disease. Phenotypical analysis of conventional lymphocytes. (a–e) Scatter‐plots showing the frequencies of CD4, CD8 T cells and double‐negative (DN) T cells, natural killer (NK) cells and B cells in healthy controls, disease controls and AAV patients in active and remission phase. (f–j) Scatter‐plots showing the absolute numbers of CD4, CD8 T cells and DN T cells, NK cells and B cells in disease controls (DC) and AAV patients in active (AP) and remission phase (RP). AAV subtypes are denoted by circle colour as granulomatosis with polyangiitis (GPA) ( ), microscopic polyangiitis (MPA) (○) and eosinophilic granulomatosis with polyangiitis (EGPA) (
 ). Data represent median and interquartile range. One‐way analysis of variance (anova) was carried out using the non‐parametric Kruskal–Wallis test and Dunn's multiple comparison post‐test. ***P < 0·.001; **P < 0·01; *P < 0·05. [Colour figure can be viewed at wileyonlinelibrary.com]