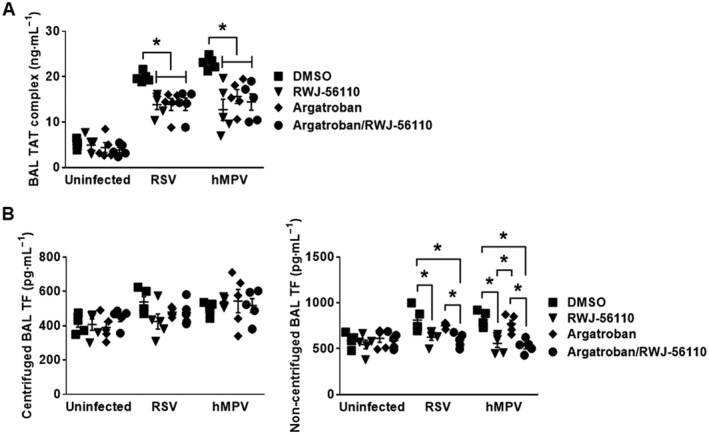
Figure 10.

Profile of TAT and TF in response to thrombin inhibition during RSV and hMPV infections. Mice were injected with DMSO or argatroban. Thereafter, they were infected or not with RSV or hMPV. They were treated in parallel with Opti‐MEM medium or RWJ‐56110. Five days after infection, mice were killed and the BAL fluids were collected for evaluating the profile of TAT and TF (n = 5 per group, *P < 0.05 RWJ‐56110 or argatroban/RWJ‐56110 vs. DMSO; argatroban vs. argatroban/RWJ‐56110; RWJ‐56110 vs. argatroban).
