
Figure 5.
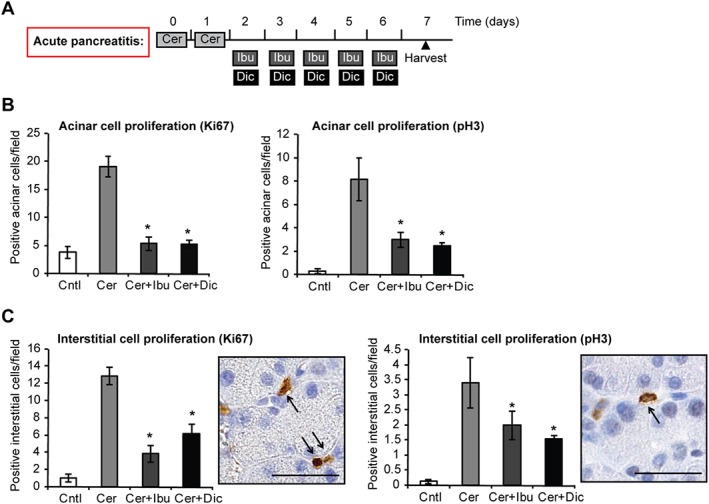
Ibuprofen and diclofenac treatments reduce acinar cell proliferation in a second model of acute pancreatitis. (A) Schematic representation of NSAID treatment using the ‘consecutive’ protocol of cerulein‐induced acute pancreatitis. Light grey boxes represent six i.p. injections of 50 μg·kg−1 cerulein (Cer) administered hourly on two consecutive days. Dark grey boxes represent two i.p. injections of 25 mg·kg−1 ibuprofen (Ibu) administered daily 4 h apart. Black boxes represent two i.p. injections of 10 mg·kg−1 diclofenac (Dic) administered daily 4 h apart. Black triangle indicates the time of animal harvest, counting from the first cerulein injection. (B) Quantification of proliferating acinar cells upon staining with the general proliferation marker Ki67 and with the mitosis‐specific marker pH 3. (C) Quantification of proliferating interstitial cells upon staining with the general proliferation marker Ki67 and with the mitosis‐specific marker pH 3. Right panels, representative microphotographs of stained cells. Results are average ± SEM (n = 5), *P < 0.05.