
Figure 8.
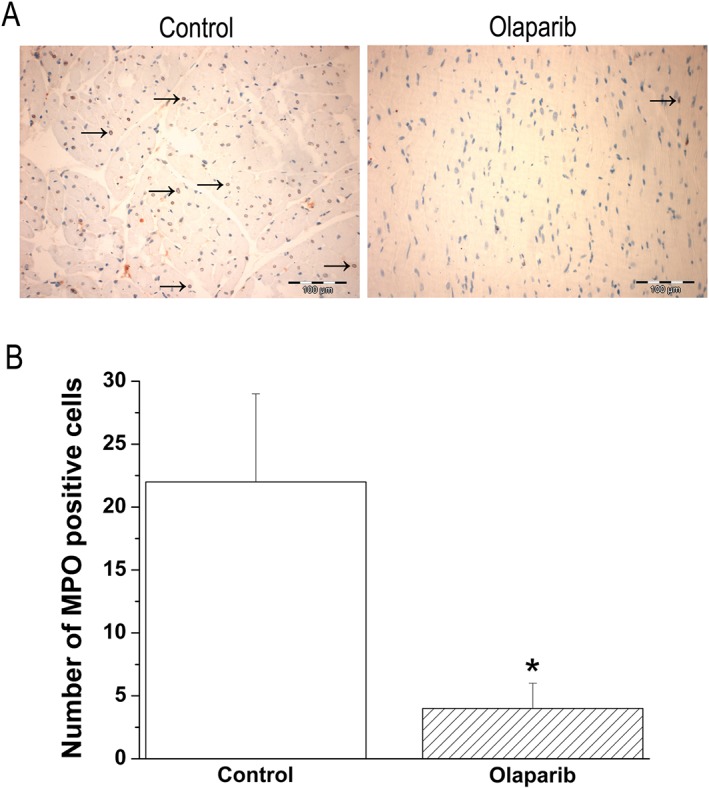
Olaparib treatment reduces neutrophil infiltration in the graft. (A) Representative photomicrographs of myeloperoxidase (MPO, magnification ×200; scale bar: 100 μm) and histological scores of (B) total number of myeloperoxidase‐expressing cells. Black arrows indicate myeloperoxidase positive cells (not all are marked). Data shown are as means ± SEM. n = 6 rats per group. *P < 0.05, significantly different from control.