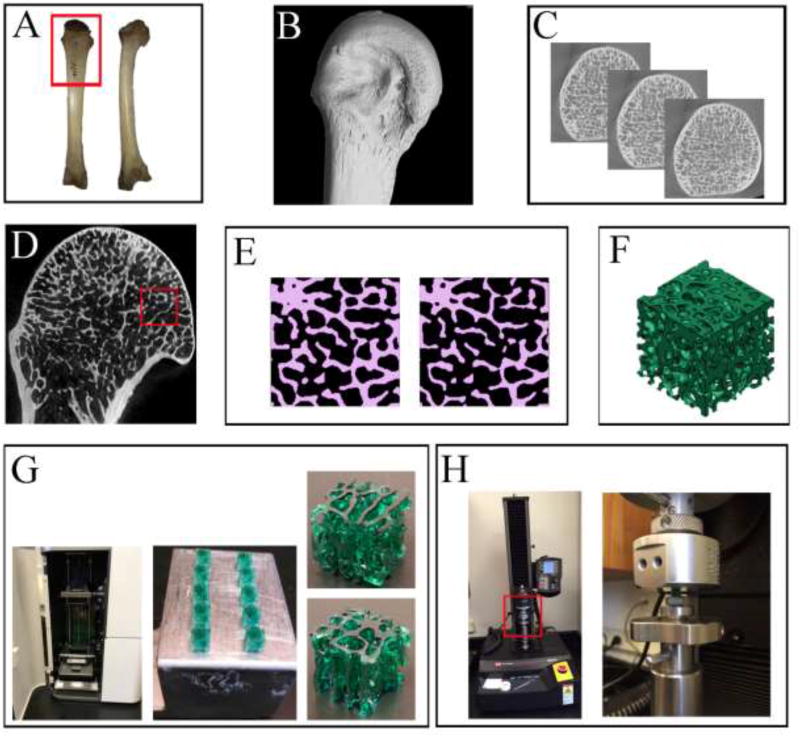
Figure 1.
An overview of the main experimental steps as described in the text. (A) A dorsal (left) and medial (right) view of the chimpanzee’s 3rd MC which was used for this project. The red frame represents the area which was micro-CT scanned. (B) A lateral view of the distal 3rd MC micro-CT reconstruction. (C) Several 2D slices in the transverse plane, displaying the internal trabecular bone structure in the MC head. (D) A close-up view of the 3rd MC head, showing (inside the red frame) where the 4.5 × 4.5mm region was selected and cropped. (E) A representative 2D slice from the cropped cube region demonstrating the binarization process (Amira 6.0). On the left the original threshold (135) and on the right the increased threshold (145) resulting in thinner, more fenestrated and sometimes severed trabeculae. (F) A 3D view of a reconstructed cube (*.stl file type) visualized with the 3D printer profiler software (3D systems). (G) The ProJet 1200 3D printer (3D systems) is shown with its printing chamber open in the left picture. Note that the printing cartridge is located at the bottom and the dynamic printing stage is suspending at the top half of the chamber. The 3DP-TCs are shown on the right. Ten printed cubes are shown still attached to the printing stage (ceneter image), and a single cube (4.5mm3) is displayed in close-up from two different orientations (left images). (H) Left: a view of the Instron 5942 universal testing machine used to load the 3DP-TCs in compression. The red frame represents the area enlarged on the right. Right: A close-up, showing the lower stationary sample-mounting stage and the upper mobile loading stage. In between them is one of the 3DP-TCs.

