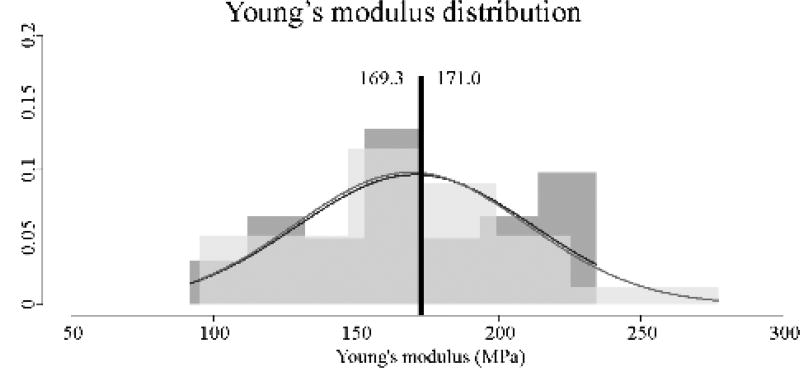
Figure 3.
Material stiffness (Young’s modulus) values for the original (n=30) and thinned (n=30) 3DP-TCs. Results revealed a non-significant difference between the two populations (P>0.05). A histogram view of the 30 material stiffness values for the original (dark grey) and thinned (light grey) 3DP-TCs. Overlapping histogram areas are represented by a medium shade of grey. Superimposed on the histograms are the corresponding normal distributions of each population. Black vertical lines denote the average. Numbers to the left and right of the black line give the average values for the thinned and original 3DP-TCs respectively.

