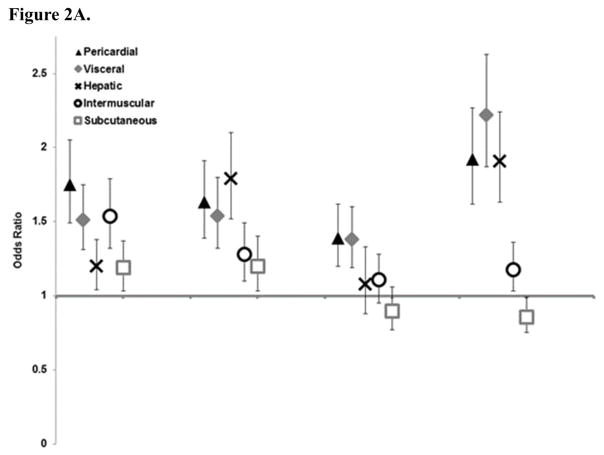
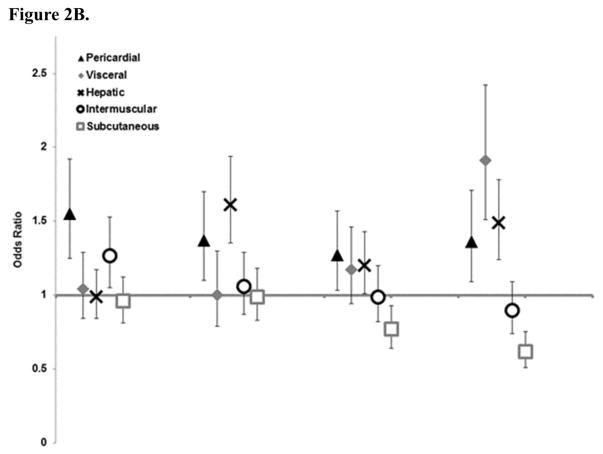
Figure 2. Association of Atherosclerotic Cardiovascular Disease Pooled Cohort Risk Score components (odds ratios and 95% confidence intervals) by one standard deviation of ectopic fat A. Univariate B. Mutually adjusted for other fat depots.
* Hepatic fat values have been inverted so high HU indicates higher level of fat in the liver.
** Standard deviation for each fat depot is: visceral fat 56cm2, subcutaneous fat 94cm2, pericardial fat 30cm3, hepatic fat 11HU, and intermuscular fat 9cm2
*** For Figure 2A all odds ratios are statistically significant at the p<0.05 level except for hepatic and intermuscular fat with high cholesterol. For Figure 2B only the following estimates are statistically significant: Hypertension with pericardial and intermuscular fat; Diabetes with pericardial and hepatic fat; High cholesterol with pericardia fat and hepatic fat; and Low HDL with pericardial, visceral, hepatic, and subcutaneous fat.


