
Fig. 15.
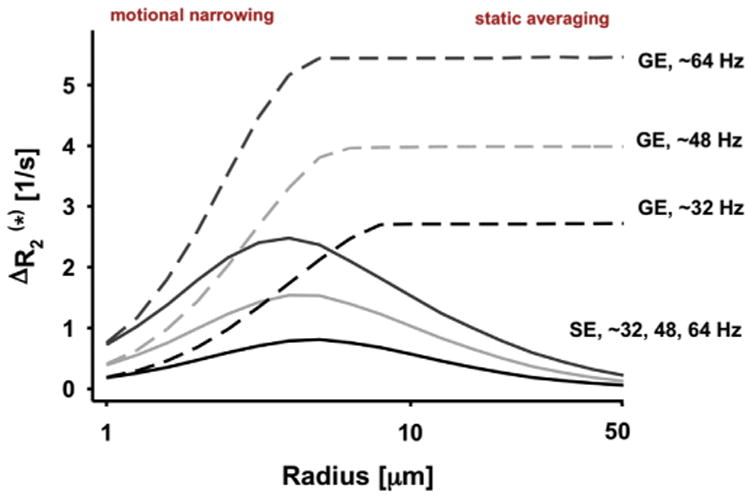
Extravascular relaxation rate changes for R2 (solid line) and R2* (dashed line) (equal to 1/T2, and 1/T2*, respectively) induced by simulated blood vessels with a magnetic susceptibility difference between blood vessel interior and exterior (basis of extravascular BOLD effect), shown as a function of blood vessel radius (horizontal axis, log scale) and magnetic susceptibility induced different frequency shifts (in Hz) across the blood vessel. The numbers 32, 48, and 64 Hz correspond to increasing magnetic field strength B0 at a constant deoxyhemoglobin concentration (∼3, 5, and 7 T at physiological conditions) or increasing deoxyhemoglobin concentration at a constant B0. GE = Gradient Echo, SE = spin echo. Adapted from Uludag and Ugurbil (2015).