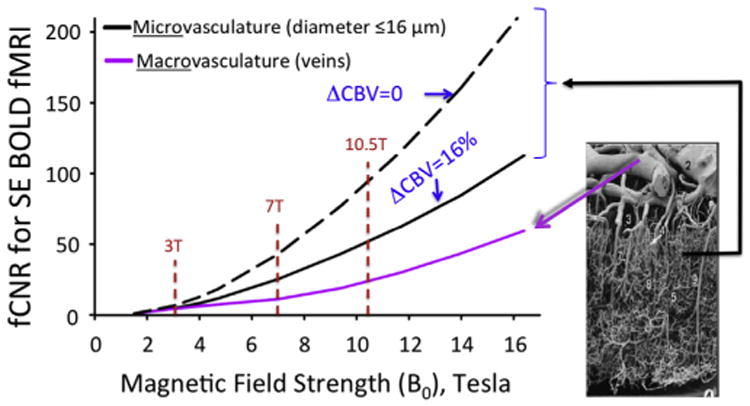
Fig. 16.

Functional Contrast-to-Noise Ratio (fCNR) for SE BOLD fMRI, normalized to the value at 1.5 T. Calculated using Eq. (1) with the parameter β set to 1. These plots are valid only in the limit where the noise in the fMRI time series is dominated by thermal noise of the images, which is the case for example, for high resolution imaging at the level of cortical columns and layers. Plots generated by Uludağ, K. using data from Uludag et al. (2009).
