
Fig. 20.
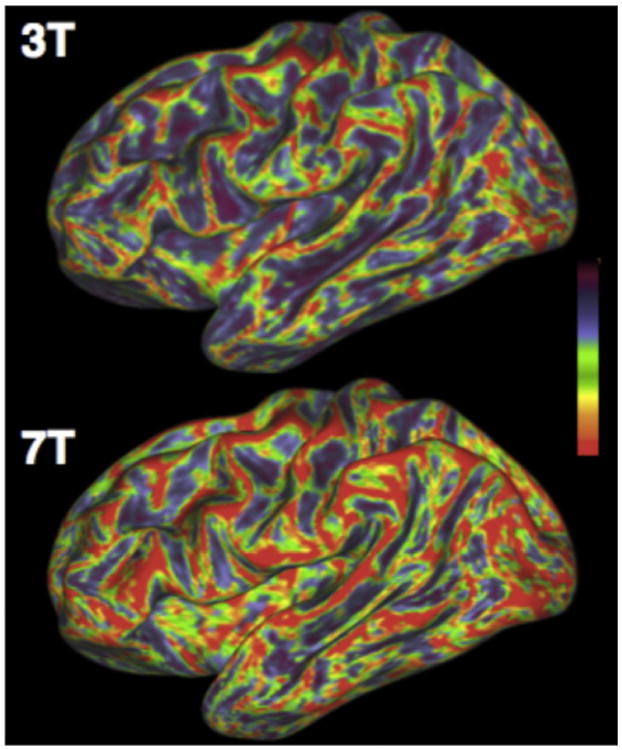
Angle between surface tangent and fiber orientations at the inflated WM/GM boundary surface for the same subject scanned at 3 and 7 T with the respective HCP protocols. For every surface vertex, the maximum dot product between fiber orientations (with volume fraction f > 5%) at this location and the surface normal is computed. This is then converted to the color-code angle shown on the inflated surface. Blue perpendicular, red parallel. From Sotiropoulos et al. (2013).