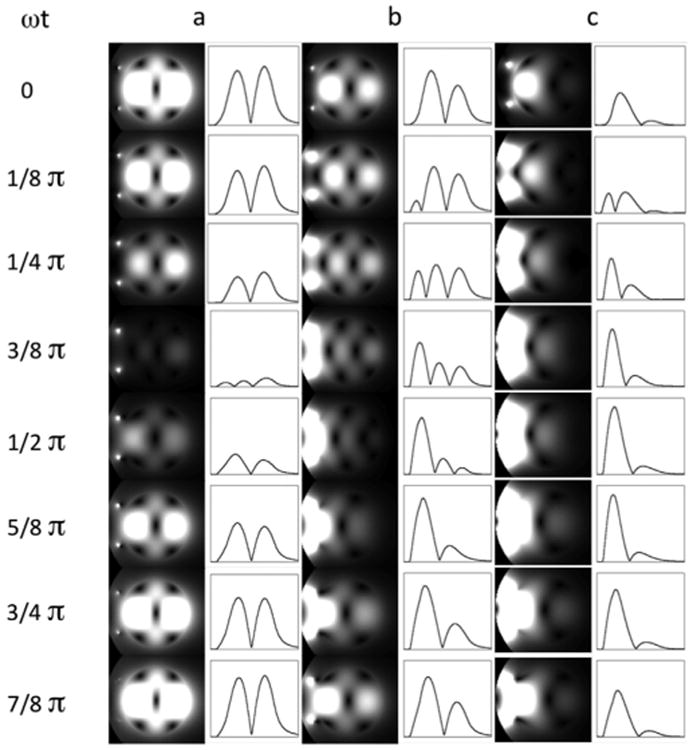
Fig. 7.

2D plots of instantaneous transverse jB1j for 7 T at progressing points in phantoms with different conductivities: (a) ωt = 0 S/m, (b) ωt = 0.26 S/m, and (c) ωt = 0.67 S/m. The intensity profiles along the horizontal centerlines are also shown on the right of the 2D plots. The surface coil position is indicated by two small dots on the left side of the phantom. Since the temporal B1 strength varies greatly among these three cases, the signal intensities of temporal points are normalized individually for each conductivity condition in order to visualize the temporal change for all the conditions clearly.
