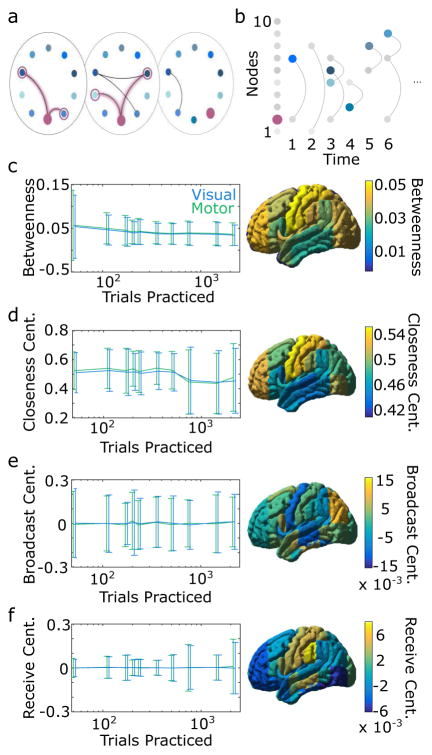
FIG. 3.
Centrality in dynamic networks. (a) Time window of the model network shown in Fig. 1a–c highlighting the fastest paths that pass through the maroon node, and therefore affect its betweenness centrality. (b) Schematic of closeness centrality for the maroon node in the model network. Closeness centrality measures the speed at which a node can reach all others: the time at which other nodes are first reached by node 2 determines its closeness centrality. Nodes are shown in color at the earliest time they are reached by node 2. (c–f ) An illustration of the notions of centrality for our example empirical fMRI data shown in Fig. 1d. (c) (Left) Betweenness centrality for visual (blue) and motor (green) regions as a function of the number of trials practiced. (Right) Averaged betweenness centrality scores across trials practiced for each brain region. (d) Closeness centrality for visual and motor regions during learning (left), and (right) averaged over the number of trials as in (c). (e) Broadcast centrality for visual and motor regions during learning (left), and the same values now averaged over all trials (right). (f ) Receive centrality for visual and motor regions during learning (left), and the same values now averaged over all trials (right). Error bars indicate two standard deviations from the mean over subjects and trials practiced. Toolbox functions used to create this figure: betweenessCentrality, closenessCentrality, broad castReceiveCentrality.

