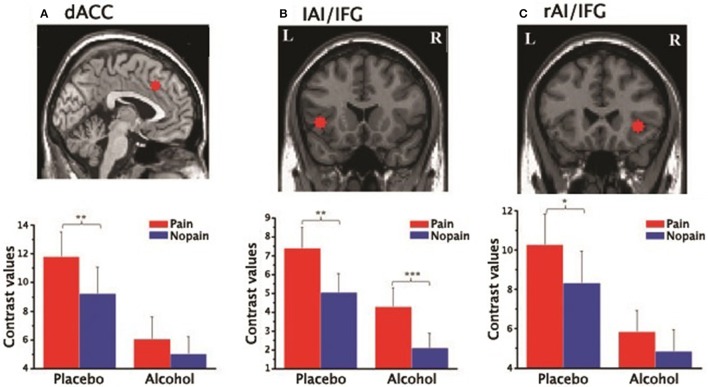
Figure 4.
Contrast values of the parameter estimates of the three ROIs of the affective pain matrix in the placebo and alcohol condition: (A) results for the dorsal anterior cingulate cortex (dACC); (B) results for the left anterior insula extending to the inferior frontal gyrus (lAI/IFG); (C) results for the right anterior insula extending to the inferior frontal gyrus (rAI/IFG). L, left; R, right; *p < 0.05, **p < 0.01, ***p < 0.001; The error bars represent the SEM.

