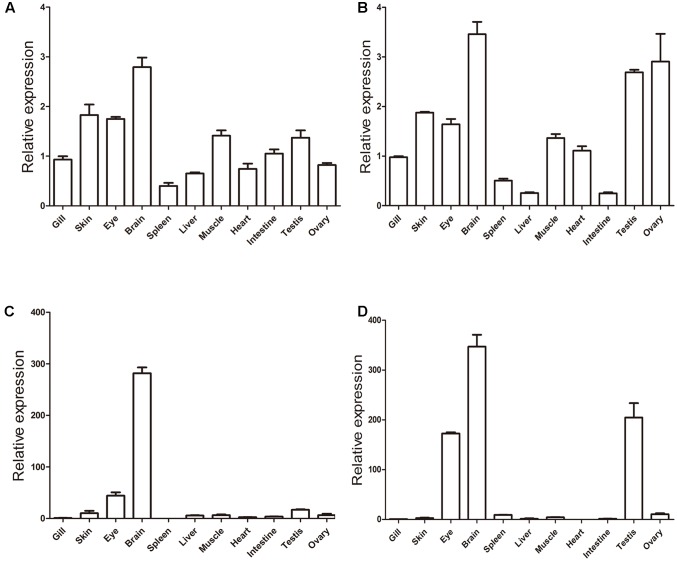
FIGURE 10.
Gene expression patterns of zebrafish (A) khdrbs1a, (B) khdrbs1b, (C) khdrbs2, and (D) khdrbs3 in different tissues. β-actin is used as internal control for normalization. Relative expression data is calculated by the method of 2-ΔΔCt. Vertical bars represent the mean ± standard deviation (SD) (n = 3). Data are from three independent experiments which were performed in triplicate.

