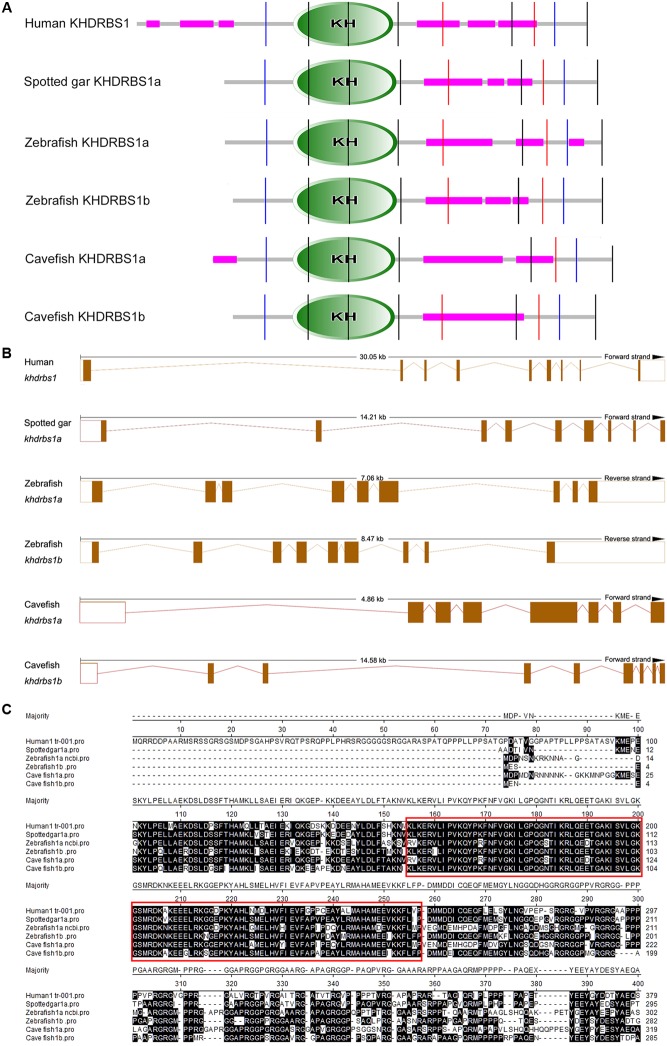
FIGURE 4.
Bioinformatic analysis of KHDRBS1 proteins in cavefish, human, spotted gar, and zebrafish. (A) Protein domain structure predictions of KHDRBS1 by SMART. Purple bars represent low complexity regions. Vertical colored lines indicate the intron positions. KH domains are shown in oval shapes with “KH”. (B) Intron–exon structures of khdrbs1. The solid boxes denote the gene coding regions, and the empty boxes mean untranscribed regions. Dotted lines represent the introns. (C) Protein sequences alignment of KHDRBS1. Protein sequences are aligned by ClustalW method in MegAlign. The highly conserved part is noted by red rectangles.

