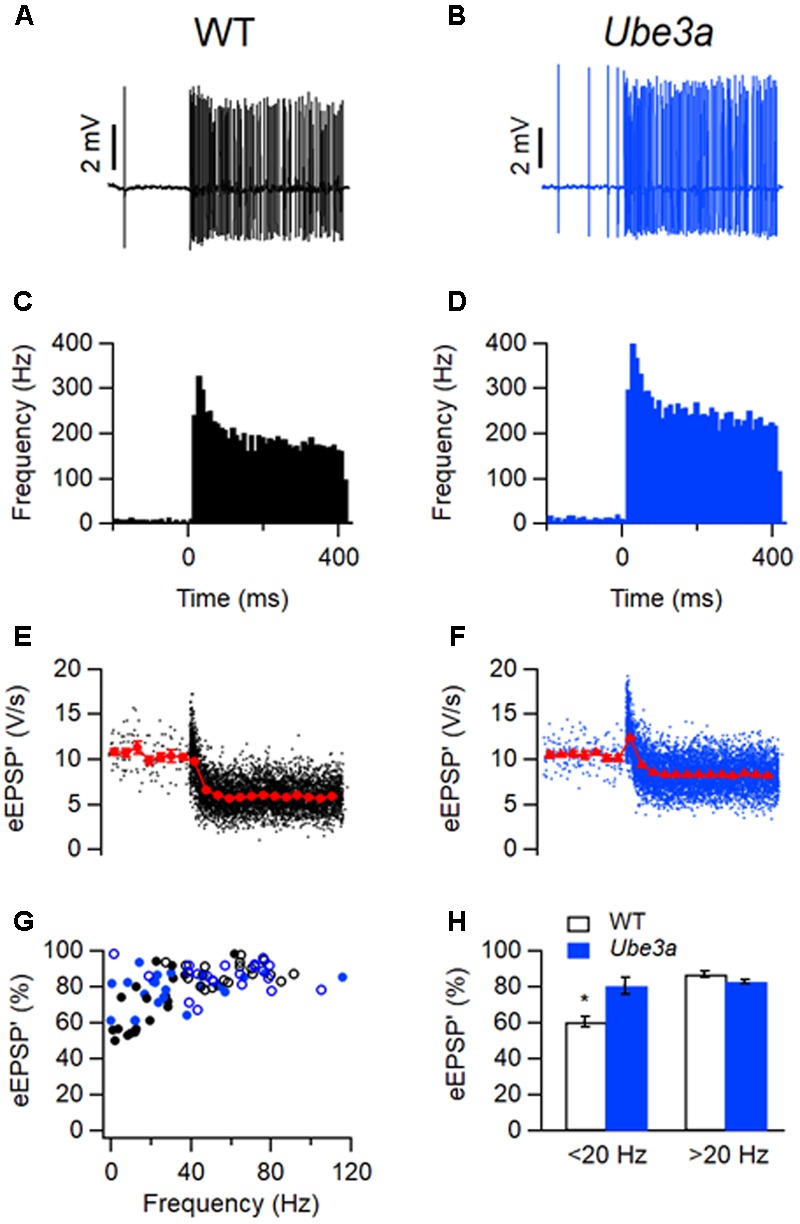
FIGURE 12.

Smaller sound-evoked STD in Ube3a mice. (A) Increase in frequency during a 400 ms, 80 dB noise burst. (C) Peristimulus time histogram showing primary-like response to sound. (E) Amplitudes of eEPSP’. Closed circles indicate time-binned averages. Bin size 30 ms. (A,C,E) are from the same WT juxtacellular recording from a C57BL/6J mouse. (B,D,F) are similar with (A,C,E), respectively, except the recording was from a unit in a Ube3aE113X mouse. (G) Relation between eEPSP’ amplitude and spontaneous firing frequency. WT and Ube3a animals are indicated in black and blue, respectively. Closed circles and open circles represent cells from C57BL/6J background and 129S2/Sv-C57BL/6J background, respectively. (H) Comparison of relative eEPSP’ amplitudes during the last 50 ms of auditory stimulation of cells with a spontaneous frequency <20 Hz and >20 Hz, respectively. ∗Indicates p < 0.05.
