FIGURE 2.

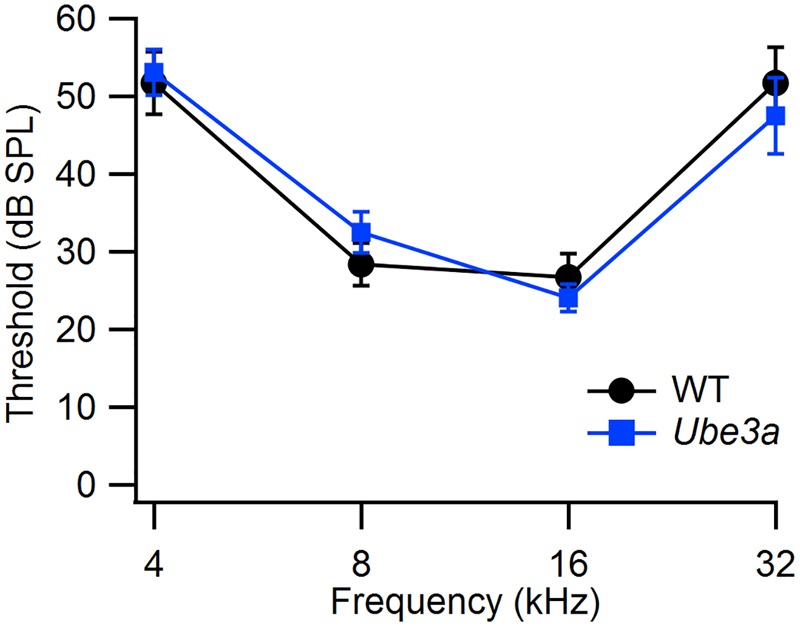
Similar hearing thresholds in WT and Ube3a mice. Comparison of the hearing thresholds between WT (n = 6) and Ube3aE113X mice (n = 11) at four different frequencies.

Similar hearing thresholds in WT and Ube3a mice. Comparison of the hearing thresholds between WT (n = 6) and Ube3aE113X mice (n = 11) at four different frequencies.