FIGURE 3.

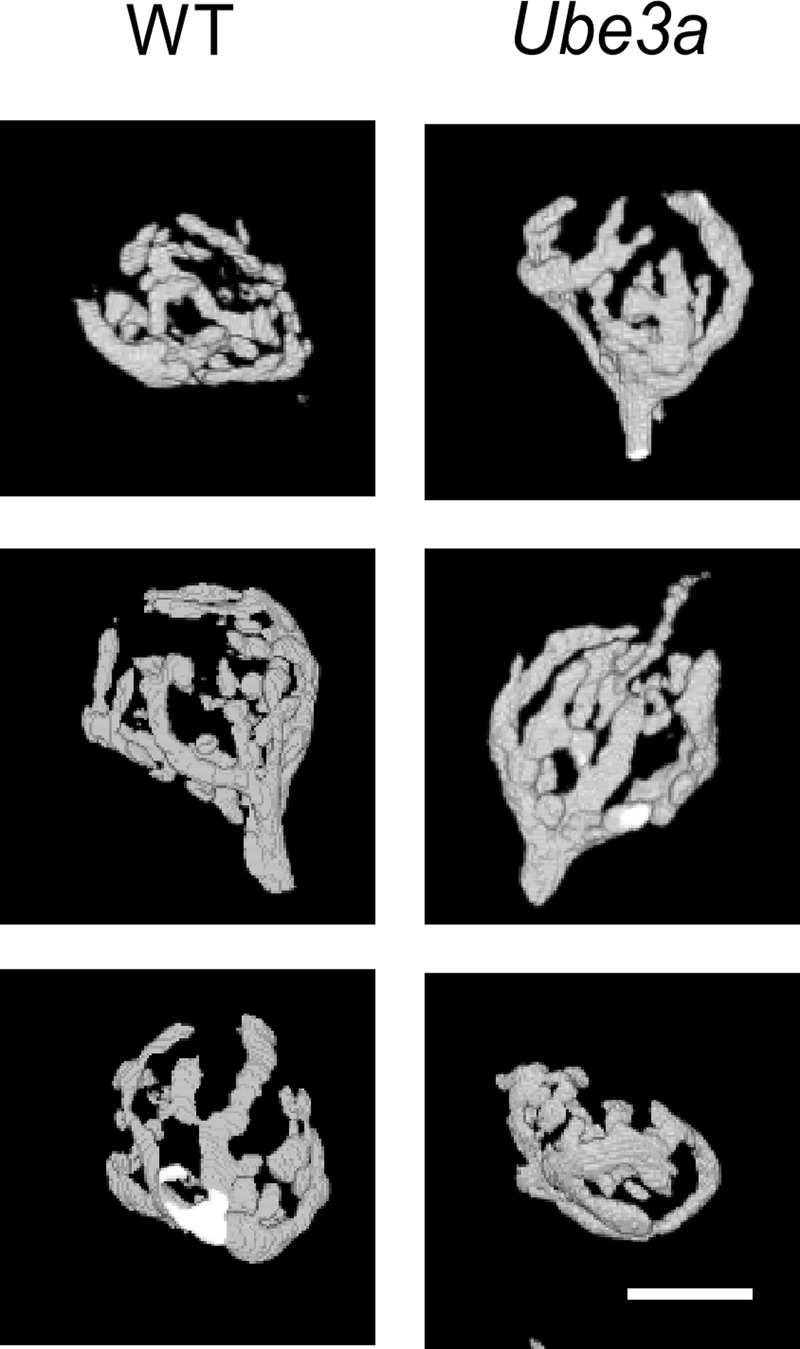
Comparison of morphology of calyx of Held from WT and Ube3a mice. Images of 3D-rendered representative calyces from WT (left column) and Ube3aE113X mice (right column). Scale bar, 10 μm.

Comparison of morphology of calyx of Held from WT and Ube3a mice. Images of 3D-rendered representative calyces from WT (left column) and Ube3aE113X mice (right column). Scale bar, 10 μm.