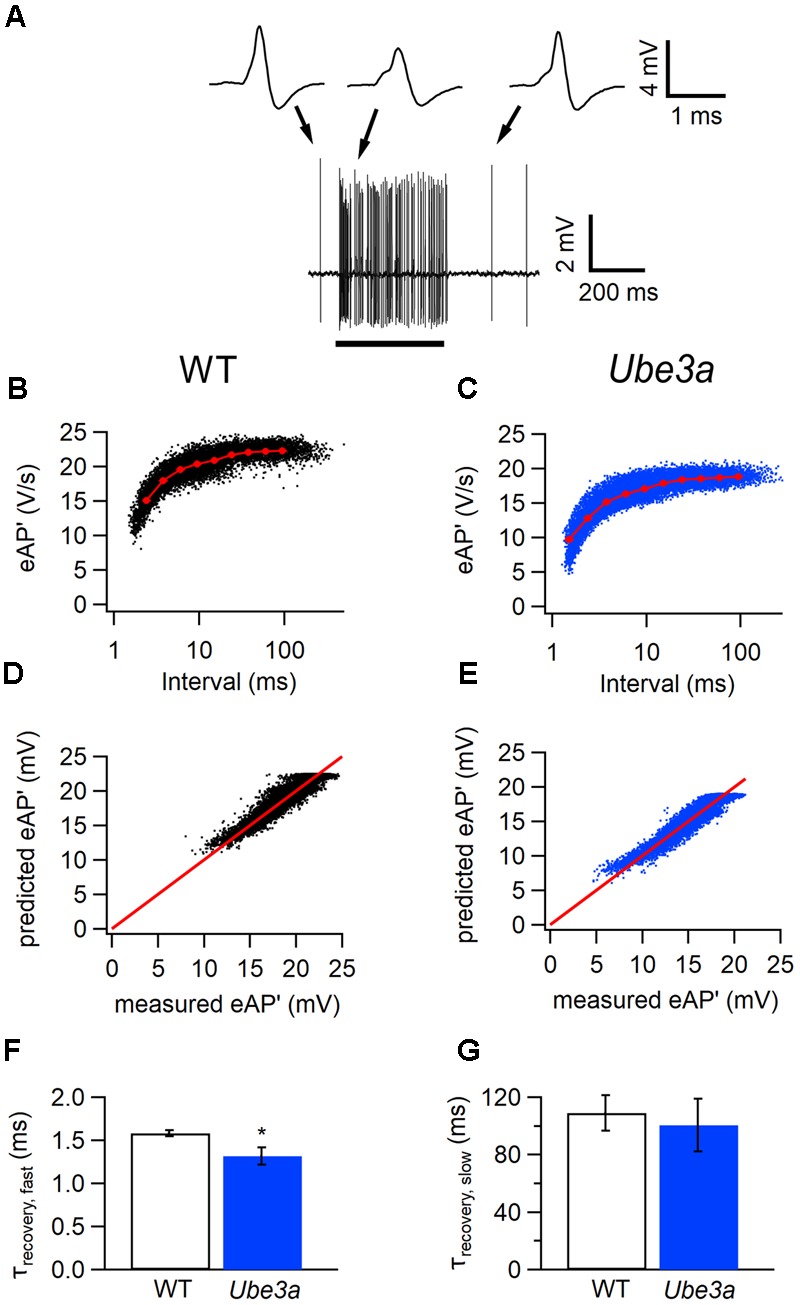
FIGURE 6.

Faster recovery from AP depression in Ube3a mice. Recordings were made in the juxtacellular (loose-patch) configuration. (A) Increase in spike frequency during a 400 ms, 80 dB noise burst (solid line). Insets are three juxtacellular complex waveforms before, during and after the sound stimulation at higher time resolution. (B,C) Relation between the maximal amplitudes of the first derivative of the eAP and the interspike interval in a cell from a C57BL/6J WT (B) and a cell from a Ube3aE113X mouse (C). Red line indicates the binned average of the values predicted by the resource depletion model. (D,E) Relation between eAP’ predicted by the model and measured eAP’ for the data shown in D and E, respectively. (F) Comparison of the fast recovery time constant from eAP depression in C57BL/6J WT and Ube3aE113X mice. ∗Indicates p < 0.05. (G) Comparison of the slow recovery time constant from eAP depression in C57BL/6J WT and Ube3aE113X mice.
