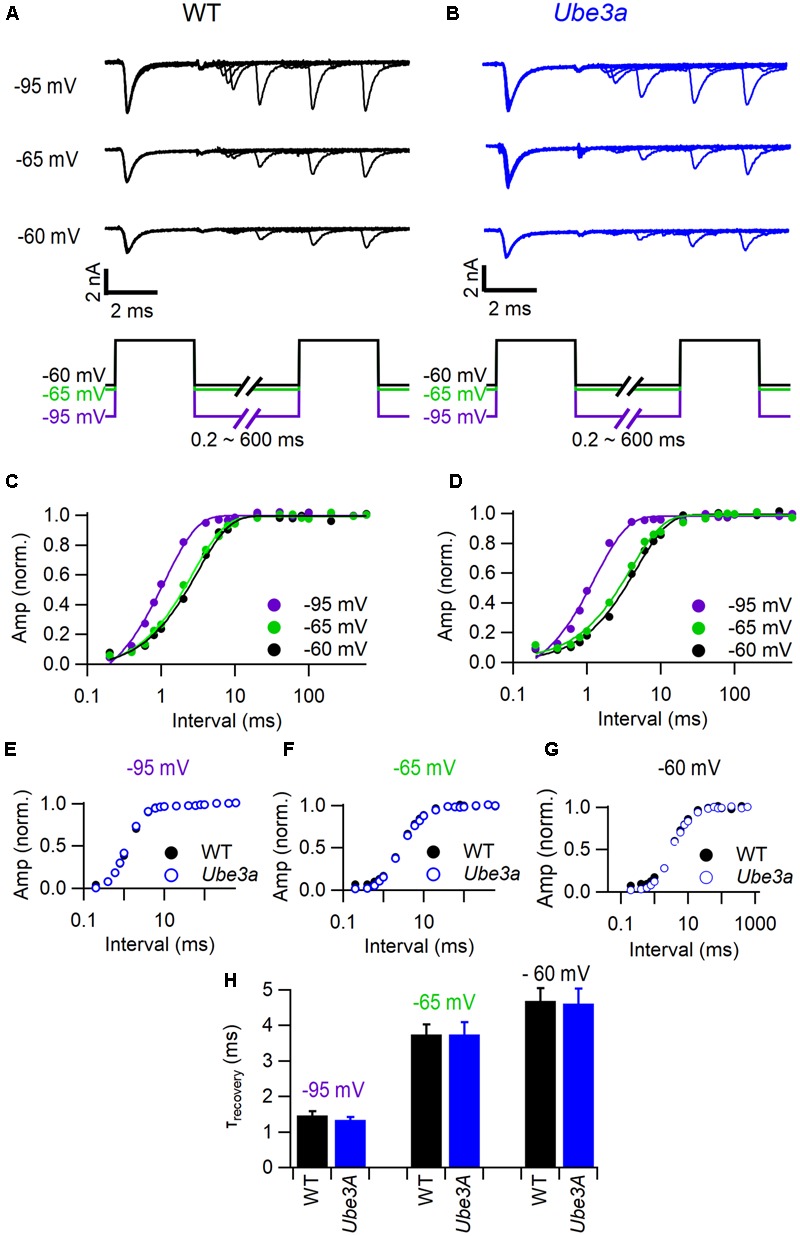
FIGURE 9.

Characterization of Na+ current recovery. (A) Top panel shows superimposed sodium current recordings from a WT C57BL/6J mouse during two 3 ms depolarizations to -10 mV at time intervals ranging from 0.2 to 600 ms from a holding potential of -95, -65, or -60 mV, respectively; bottom panel shows the stimulation protocol. (B) As A, but from a Ube3aE113X mouse. (C) Dependence of the relative sodium current amplitude on the recovery time interval at a holding potential of -95 mV (purple), -65 mV (green), and -60 mV (black); same cell as A; lines indicate mono-exponential fit. (D) As C, but from the same cell as B. (E) Average recovery of sodium current at a holding potential of -95 mV (purple) in wild type (filled circles) and Ube3a mutant mice (open circles). (F) As E, except holding potential -65 mV (green). (G) As E, except holding potential -60 mV (black). (H) Comparison of average recovery time constant in different holding potentials between wild type (black) and Ube3aE113X (blue) mice.
