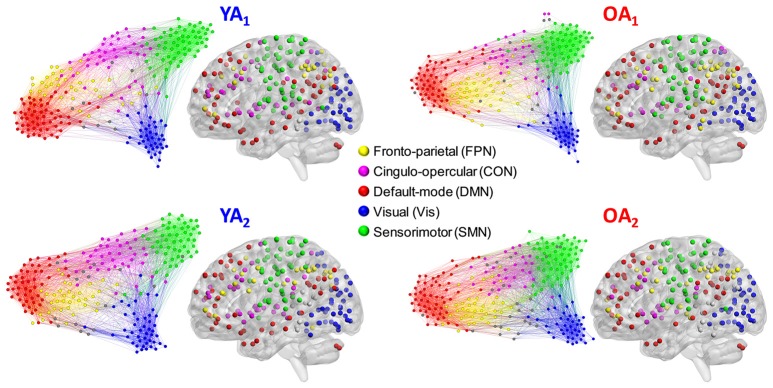
Figure 1.
Representative group-level partitions. Functional networks were identified separately for each group and time point, using consensus partitioning. Five main modules were identified in both YA and OA, consistent with the main functional networks described in the literature (see main text for details). Nodes are color-coded by module, and within-module connections are displayed in the same color as the nodes. Nodes not belonging to the five main modules are displayed in gray. For illustration purposes, the force-directed graph displays 20% of the strongest connections and the anatomical projection displays nodes that form 2% of the strongest connections. The force-direct graph and anatomical projection were displayed using Gephi (http://gephi.org) and BrainNet Viewer (http://www.nitrc.org/projects/bnv/), respectively.

