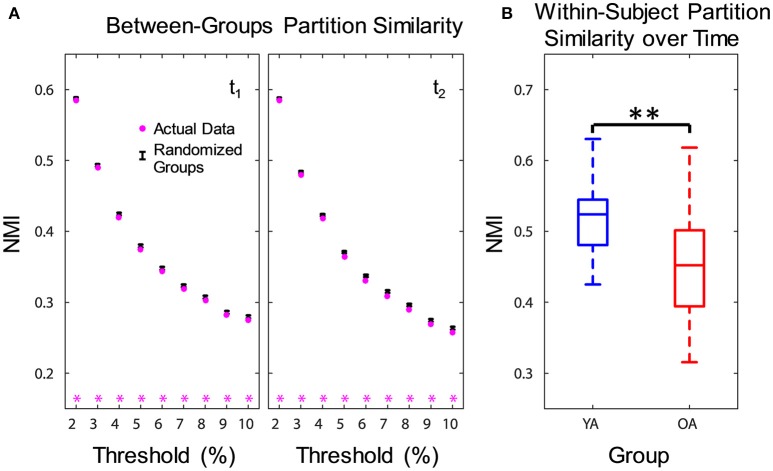
Figure 2.
Age differences in community structure. Similarity of community structure between YA and OA was significantly lower than expected based on the permuted data, at both time points and consistently across all thresholds (A). Also, OA showed less within-subject partition similarity across time (B). Boxplots in the right panel depict values averaged across all thresholds. NMI, normalized mutual information; t1, time point 1; t2, time point 2; YA, younger adults (blue color); OA, older adults (red color). Magenta asterisks indicate p < 0.05 for each threshold. **p < 0.01, across all thresholds.

