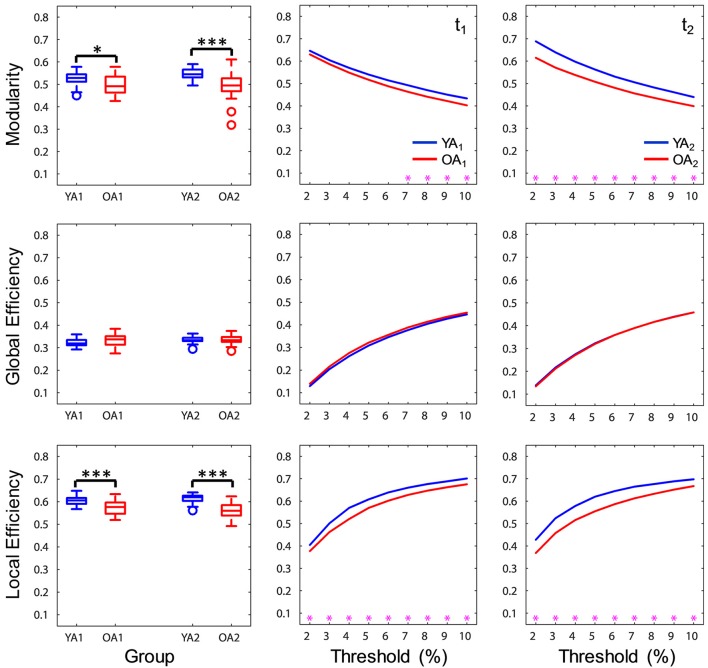
Figure 3.
Age differences in brain-wide network measures. At a brain-wide level, OA showed lower modularity and local efficiency compared to YA, whereas global efficiency was not significantly different across groups. Boxplots in the left panel depict values averaged across all thresholds. YA, younger adults (blue color); OA, older adults (red color); t1, time point 1; t2, time point 2. Magenta asterisks indicate p < 0.05 for each threshold. *p < 0.05, ***p < 0.001, across all thresholds.

