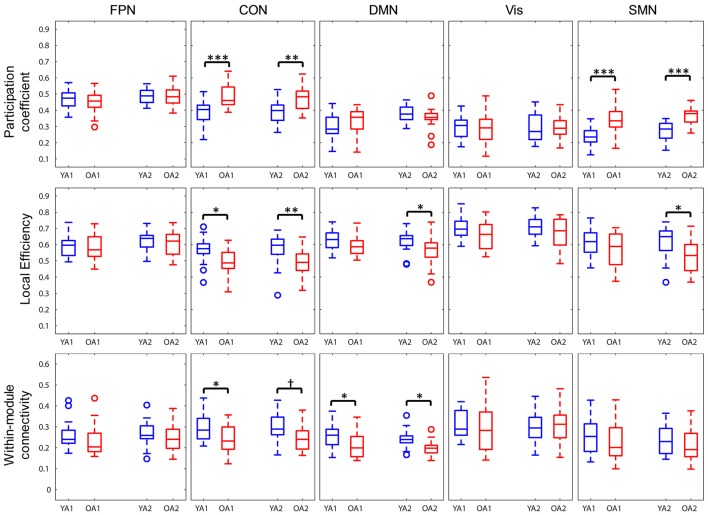
Figure 5.
Age differences in individual network measures. OA showed greater participation coefficients for CON and SMN, lower local efficiency for CON, and for DMN and SMN only at t2, and lower within-module connectivity within DMN and within CON, compared to YA. FPN, fronto-parietal network; CON, cingulo-opercular network; DMN, default-mode network; Vis, visual network, SMN, somato-sensorimotor network; YA, younger adults (blue color); OA, older adults (red color). *p < 0.05, **p < 0.01, ***p < 0.001, across all thresholds and corrected for multiple comparisons. †p = 0.016, across all thresholds, uncorrected.

