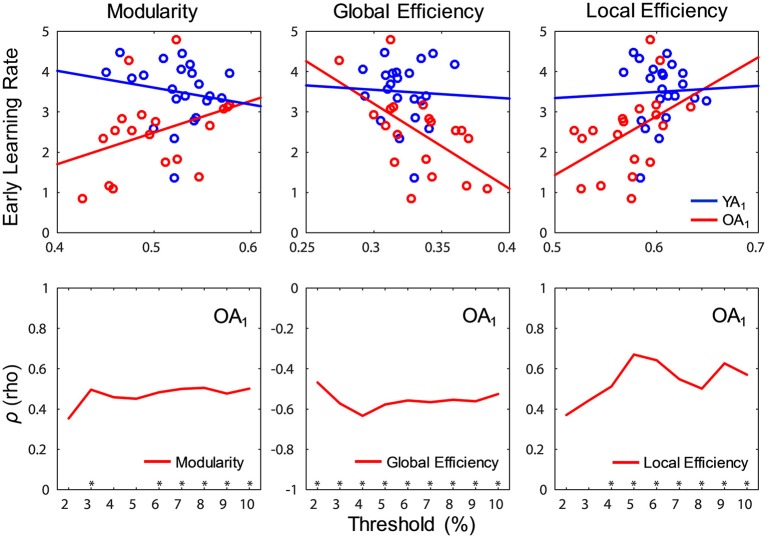
Figure 6.
Relations between network measures and learning during WM training. (Top) Modularity (ρ = 0.51, p = 0.028) and local efficiency (ρ = 0.59, p = 0.01) were positively correlated, whereas global efficiency (ρ = −0.61, p = 0.007) was negatively correlated with early learning rates in OA (red color), only at t1; blue and red lines show least squares lines. (Bottom) Relations between network measures and learning rates (Spearman correlation) were fairly constant across thresholds. t1, time point 1; YA, younger adults (blue color); OA, older adults (red color). *p < 0.05, for each threshold.

