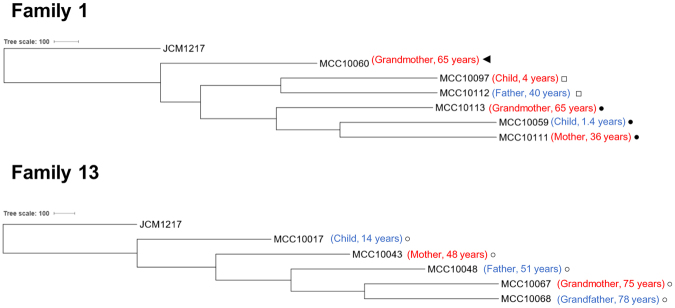
Figure 6.
Cladogram of strains transmitted across three generations. Phylogenetic tree representing the relationships between five strains putatively transmitted across three generations. The tree was calculated based on the nucleotide sequence of 642 single-core gene families among 145 B. longum strains analysed in this study (see Supplementary Table S5). B. longum subsp. longum JCM 1217 T was used as an outgroup. Isolation source for each strain is shown in parenthesis (blue: male; red: female). Same symbols indicate strains predicted to be transmitted between family members.

