Figure 6.
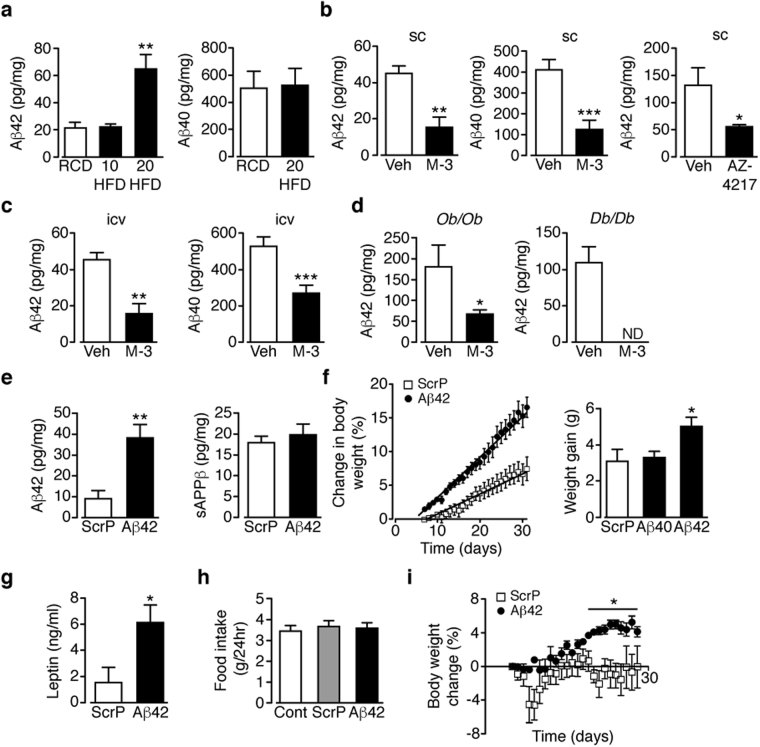
Central Aβ1–42 increases body weight and fat mass of HFD mice. (a) Hypothalamic Aβ1–42 after 20 weeks RCD (n = 9) and 10 (n = 7) and 20 (n = 10) weeks HFD, and Aβ1–40 after 20 weeks RCD (n = 11) and HFD (n = 11). (b,c) Hypothalamic Aβ1–42 and Aβ1–40 in DIO mice after sc vehicle, sc M-3 or oral AZ-4217 (b) and (c) icv M-3 for 14 days (n = 7–12/group). (d) Hypothalamic Aβ1–42 in ob/ob and db/db mice after sc vehicle or M-3 (n = 4–7). (e) Hypothalamic Aβ1–42 and sAPPβ after 10 weeks HFD then 28 days icv ScrP or Aβ1–42 (n = 5). (f) Percentage increase in body weight in HFD mice given icv ScrP or Aβ1–42 and actual weight increase for mice given icv ScrP, Aβ1–42 or Aβ1–40 (n = 9–17/group). (g) Plasma leptin after icv treatment with ScrP or Aβ1–42 (n = 10). (h) Food intake of HFD mice given ScrP or Aβ1–42, compared to non-treated controls (n = 13–15/group). (i) Percentage body weight change in RCD mice given icv ScrP or Aβ1–42 (n = 6). Data are means ± SEM. *P < 0.05, **P < 0.01, ***P < 0.001 by one-way ANOVA (a,f,h) or two-way ANOVA with Bonferroni’s multiple comparisons test (f,i) or 2-tailed unpaired Student’s t-test ((b–e,g) body weight gain in f).

