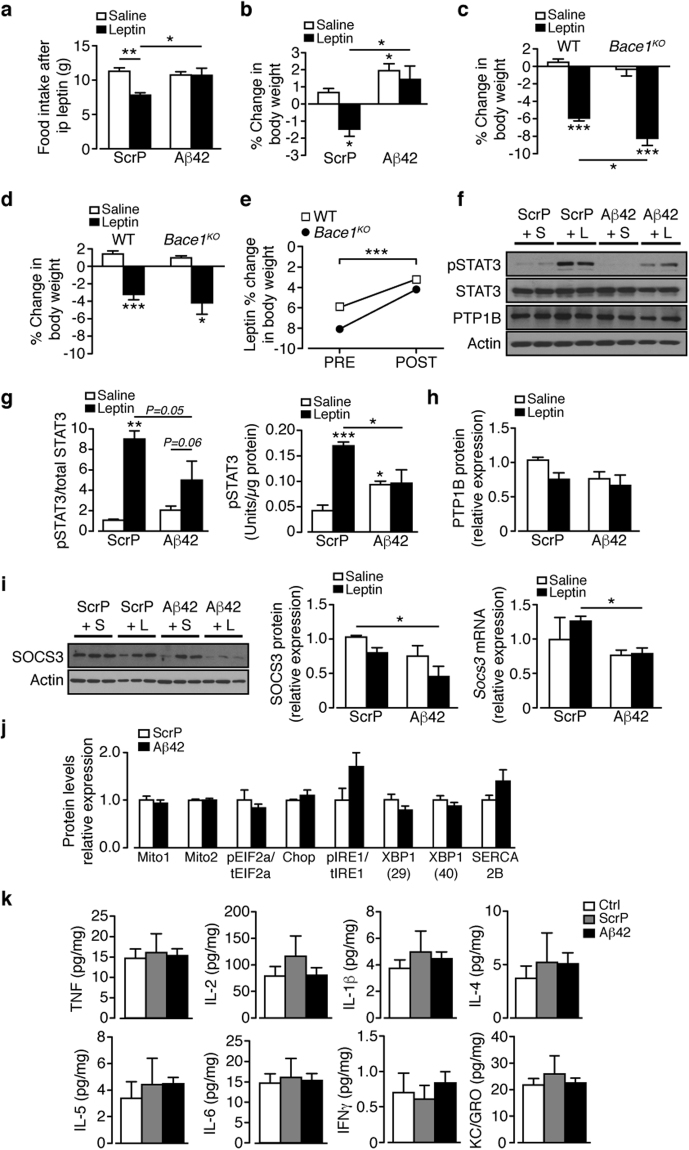
Figure 7.
Central Aβ1–42 decreases hypothalamic leptin sensitivity of HFD mice. (a,b) ScrP or Aβ1–42 (3.36 µg/kg) given to HFD mice (starting at week 6) for 35 days, then given saline or leptin (2 mg/kg) twice daily for 3 days (n = 8–9/group). Food intake (a) and percentage body weight change (b) at end of injection period. (c) RCD WT (n = 7/group) and Bace1 KO (n = 4/group) mice given saline or leptin (2 mg/kg) twice daily for 3 days and percentage body weight change determined. (d) 7 days later icv osmotic minipumps were inserted and Aβ1–42 (10 µg/kg) given to all mice for 21 days, then leptin sensitivity tested as above over the last 3 days. (e) leptin responsiveness of WT and Bace1 KO mice before (PRE) and after (POST) Aβ1–42 treatment. (f) Immunoblots for saline and leptin-stimulated pSTAT3Tyr705, STAT3, PTP1B, and actin of HFD mice given ScrP or Aβ1–42, then injected with saline or leptin. (g) Ratio of signal intensities for pSTAT3Tyr705 to STAT3 (n = 5–7/group) and pSTAT3Tyr705 (n = 6–10/group) by ELISA in ScrP and Aβ1–42 treated mice after injection of saline or leptin. (h) Quantified signal intensity of PTP1B to actin for mice given ScrP or Aβ1–42 after injection of saline or leptin (n = 5–7/group). (i) Immunoblots of SOCS3 and actin of HFD mice given ScrP or Aβ1–42 after injection of saline or leptin, with quantified signal shown (n = 5–7/group). RT-qPCR for Socs3 for mice given ScrP and Aβ1–42 after injection of saline or leptin (n = 5–6/group), (j) Hypothalamic relative protein levels of ER stress markers in HFD mice given ScrP or Aβ1–42 (n = 5–7/group). (k) Hypothalamic cytokine levels by ELISA in HFD mice given ScrP or Aβ1–42 compared to untreated controls (n = 5–13/group). Data are means ± SEM. *P < 0.05, **P < 0.01, ***P < 0.001 by one-way ANOVA with Bonferroni’s multiple comparisons test (a,b,c,d,g,k), two-way ANOVA (e), Kruskal-Wallis test (h,i) or 2-tailed Student’s t-test with Welch correction (j). Uncropped images of immunoblots can be found in Supplementary Fig. 11.

