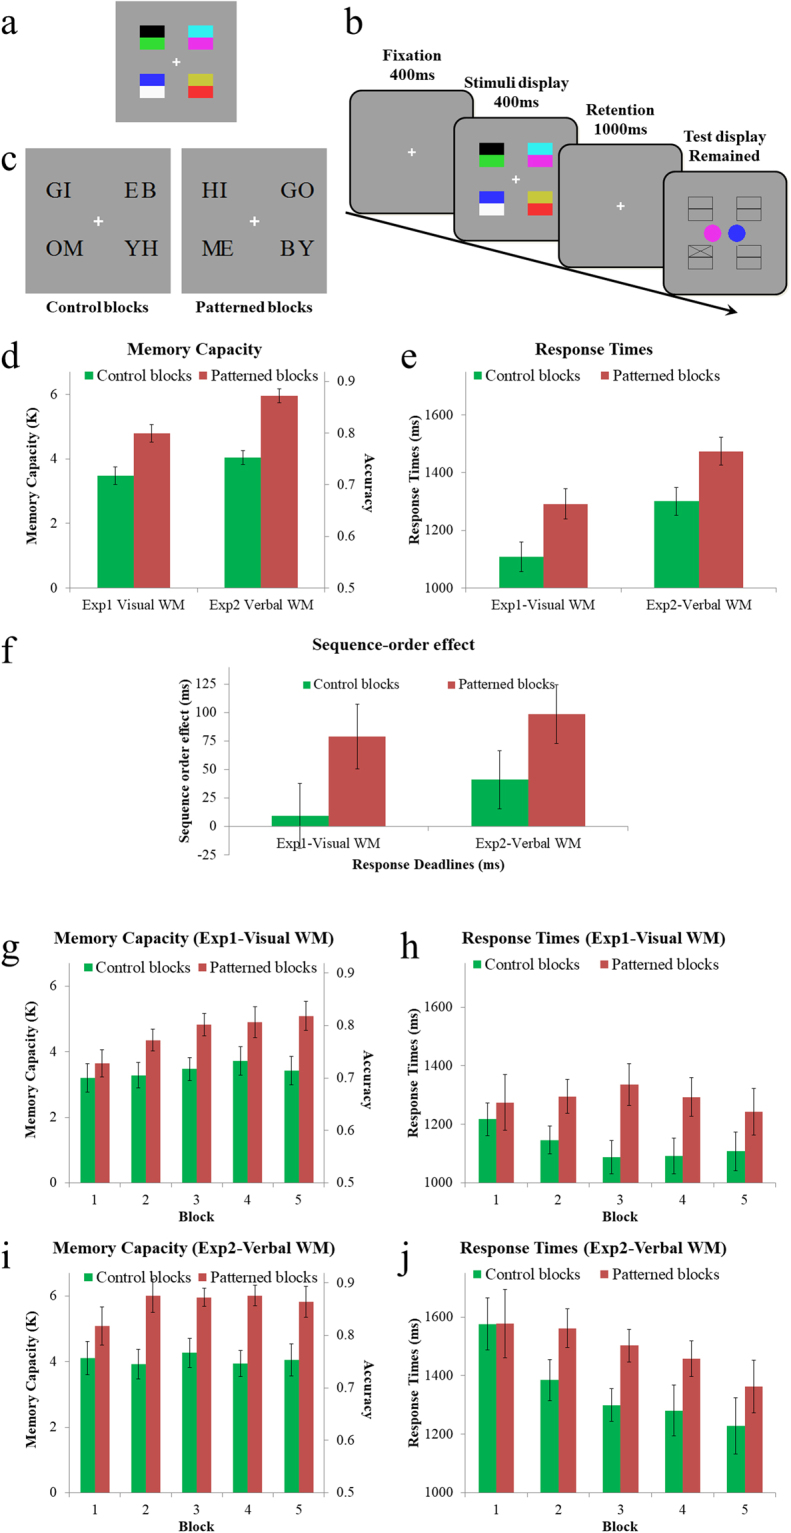
Figure 2.

Methods and results of Experiment 1–2. Panel (a and c) respectively shows sample stimuli displays of 8 colors (Experiment 1) and 8 letters (Experiment 2). Panel (b) shows the sequence of presentations: the stimuli were presented for 400 ms and then disappeared. One second following its disappearance, the test display was presented marking 1 of the 8 positions and showing two choices, one of which had appeared in this marked position. Panel d shows the memory capacities (left-side axis), which was estimated from the accuracies of responses (right-side axis): K = (accuracy-0.5) × 16. Memory capacity significantly increased in patterned blocks than control blocks, confirming the previous finding. More importantly, the response times were significantly slower in the patterned than the control blocks (Panel e). Panel f shows the sequence-order effect: the RT advantage of top-color over bottom-color in Experiment 1, or left-side letter over right-side letter in Experiment 2. The sequence-order effect was significantly smaller in control blocks than in patterned blocks, and suggests that when a pair in the patterned blocks needs to be decoded, the individual items are retrieved in a stereotyped order. Panels (g–j) show the time-course of these effects. Consistent with the Brady, et al.1, for both accuracy (i.e., memory capacity) and RTs, the differences between the patterned and control blocks were relatively small in Block 1, and these differences gradually increase with more learning processing. Error bars show within-subject 95% confidence intervals32.
