Figure 2.
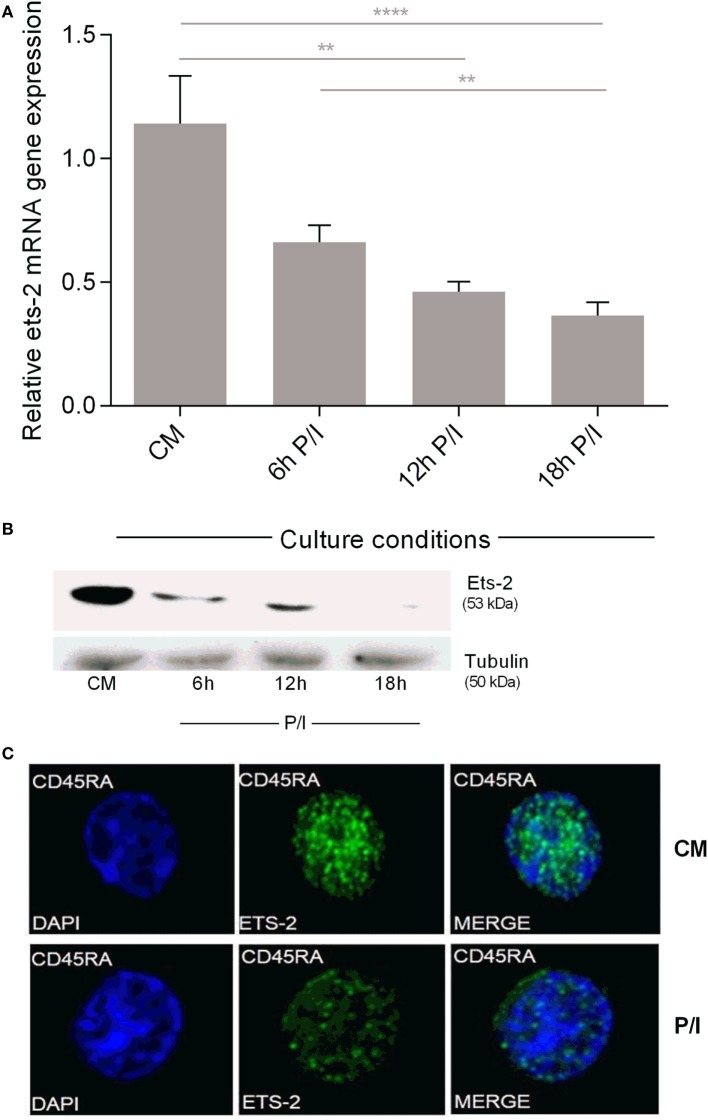
Ets-2 mRNA and protein expression levels in resting vs activated naive T helper (Th) cells. (A) Relative Ets-2 mRNA gene expression levels measured by real-time PCR in naive Th cells isolated and cultured in CM or P/I for 6, 12, and 18 h. β2-m served as the normalizer gene for relative expression. The results are presented as the mean values (SD) from three independent experiments. Statistically significant differences are indicated by asterisks (**p < 0.01, ****p < 0.0001, one-way ANOVA). (B) Western blot analysis of Ets-2 protein levels in naive Th cells isolated and cultured in CM or P/I for 6, 12, and 18 h. β-Tubulin protein levels were used as an internal control for equal loading. The results shown are representative of at least three independent experiments. (C) Relative amounts of Ets-2 protein in the nuclei of resting and 6 h-activated naive Th cells shown by immunofluorescence. The cells were stained for the Ets-2 protein (green), and the nuclei were counterstained with 4,6-diamidino-2-phenylindole (DAPI) (blue). Images are from a Leica TCSSP5 confocal microscope, 63× objective. The results shown are representative of at least three independent experiments.

