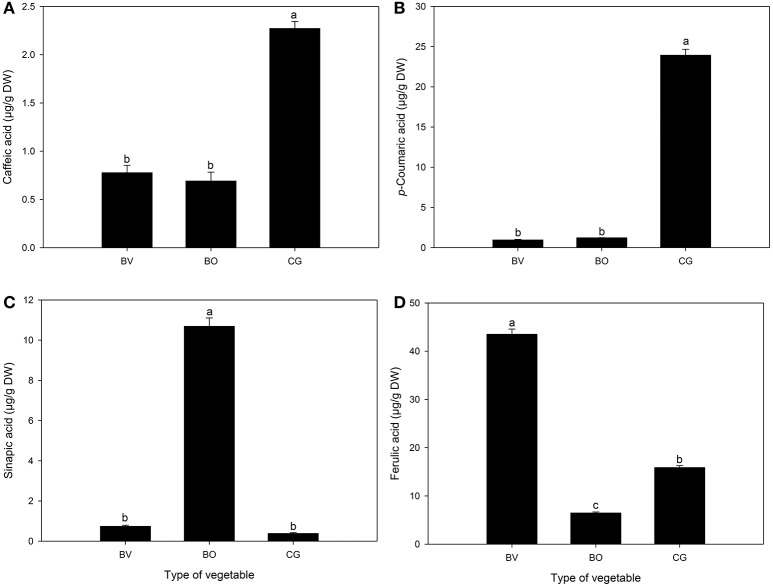
Figure 4.
The concentration (μg/g DW) of different hydroxycinnamic acid derivatives detected and quantified in Beta vulgaris (BV), B. oleracea (BO) and Cleome gynandra (CG). (A) Caffeic acid; (B) p-Coumaric acid; (C) Sinapic acid; (D) Ferulic acid. Data are mean ± standard error (n = 3). In each graph, bars with different letter are significantly different based on Duncan's multiple range test (P ≤ 0.05). Data analysis was performed using SPSS (Version 16).

