
Figure 2.
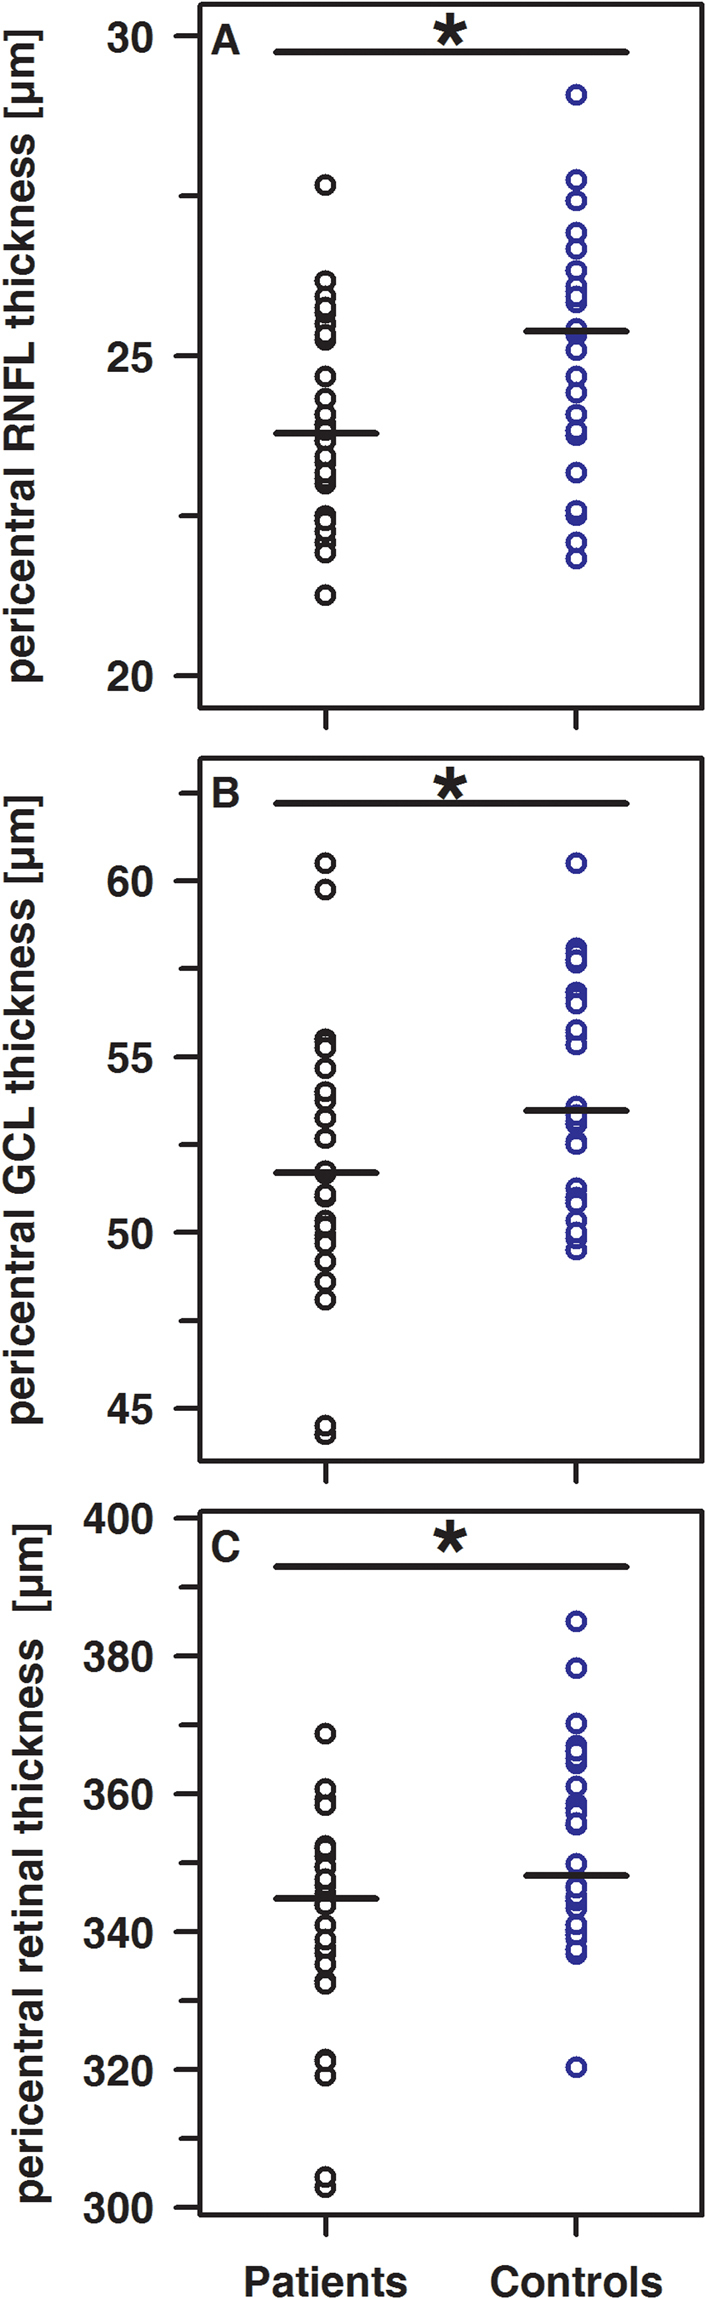
Significant differences (each p < 0.05) of the pericentral thickness of the RNFL (A), the GCL (B) and ALL (C) in patients (black circles) and controls (blue circles).
Official websites use .gov
A
.gov website belongs to an official
government organization in the United States.
Secure .gov websites use HTTPS
A lock (
) or https:// means you've safely
connected to the .gov website. Share sensitive
information only on official, secure websites.
Significant differences (each p < 0.05) of the pericentral thickness of the RNFL (A), the GCL (B) and ALL (C) in patients (black circles) and controls (blue circles).