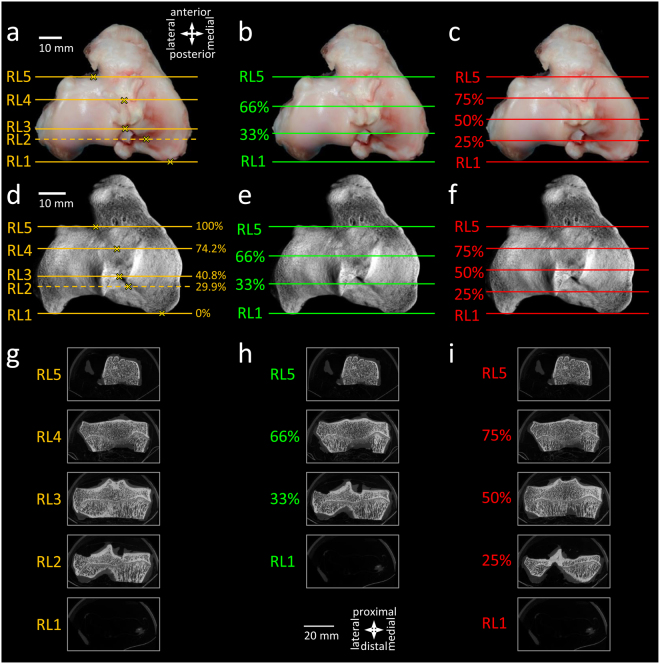
Figure 3.
Comparison of subregion systems of the ovine tibial plateau. (a–c) Macroscopic images and (d–f) 3-D reconstructed micro-CT images of a left tibial plateau, showing the reference lines defining the boundaries of the regions. (g–i) 2-D micro-CT slices corresponding to the reference lines. Subregion systems using (a,d,g) the newly defined reference lines described in the present manuscript, and a division of the tibial plateau into (b,e,h) thirds and (c,f,i) quarters by using RL1 and RL5 as the boundaries of the tibial plateau. Directions are identical for panels a–f, and g–i, respectively. Scale bars are identical for panels a–c, d–f, and g–i, respectively.

