Fig. 5.
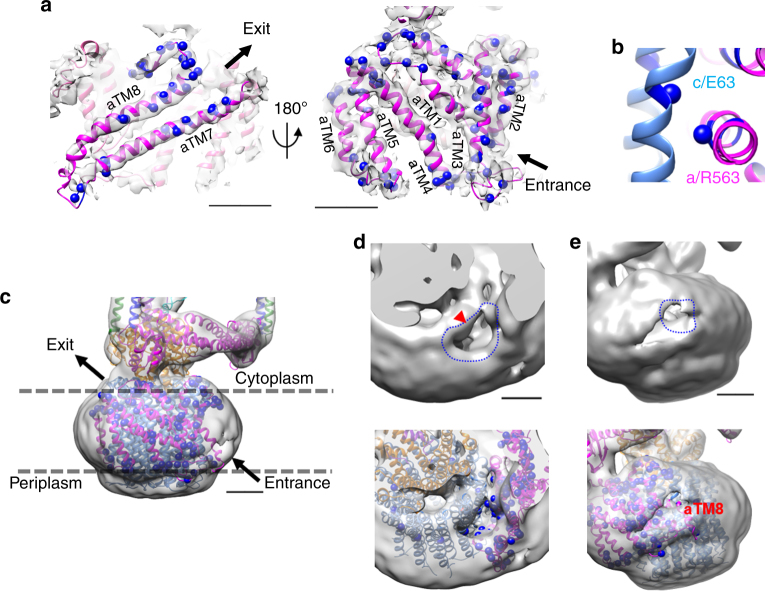
Structure of the membrane embedded domain. a The side views of the a-subunit. The homology model of the a-subunit was fitted into the map of state1 by MDFF. Expected paths of proton exit and entrance are shown by black arrow when the enzyme functions as an ATP synthase. Polar residues are depicted in blue sphere format. Scale bar, =20 Å. b A magnified view of contact surface between the c-ring and the a-subunit at cytoplasmic pore. The essential residues coupled protonation (E63 on c-subunit and R563 on a-subunit) are shown by sphere format. c Overview of the membrane embedded domain. The directions of the proton flow indicated by black arrows correspond to a. Scale bar, 20 Å. d, e Close-up views from the cytoplasmic (d) and periplasmic (e) side. Large cavities are outlined in blue. Viewed from the cytoplasm (d), density corresponding to residues indicated in b is apparent (red arrow). Scale bar, 20 Å

