Figure 7.
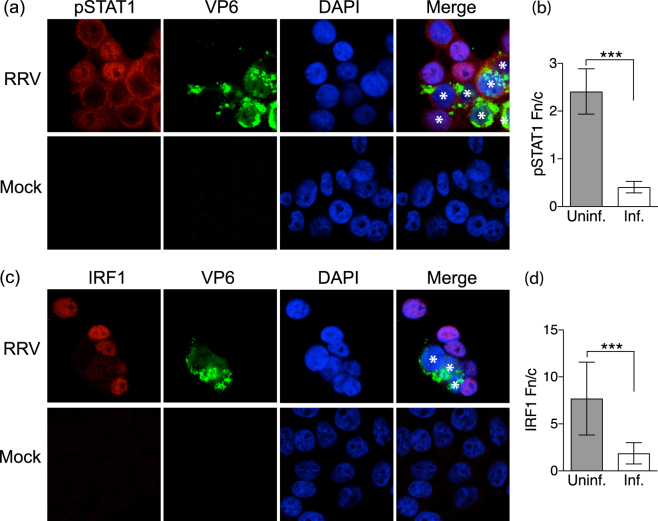
Localization of activated STAT1 and IRF1 in rotavirus-infected and bystander cells. HT-29 cells were infected with RRV at a m.o.i. of 1 or mock-infected. After 7 h cells were fixed, permeabilised and stained with antibodies to rotavirus VP6 and phosphorylated STAT1 (pSTAT1; a,b) or VP6 and IRF1 (c,d). Nuclei were stained with DAPI and representative images obtained by confocal microscopy. The VP6-positive (infected) cells in the merged images are indicated with white asterisks. Nuclear to cytoplasmic fluorescence ratios (Fn/c) of pSTAT1 (b) and IRF1 (d) were calculated for the uninfected and infected cell populations, analysing 7 to 14 randomly selected cells of each population type from 2 independent experiments. Images were obtained at ×1000 magnification. ***P < 0.0001.

