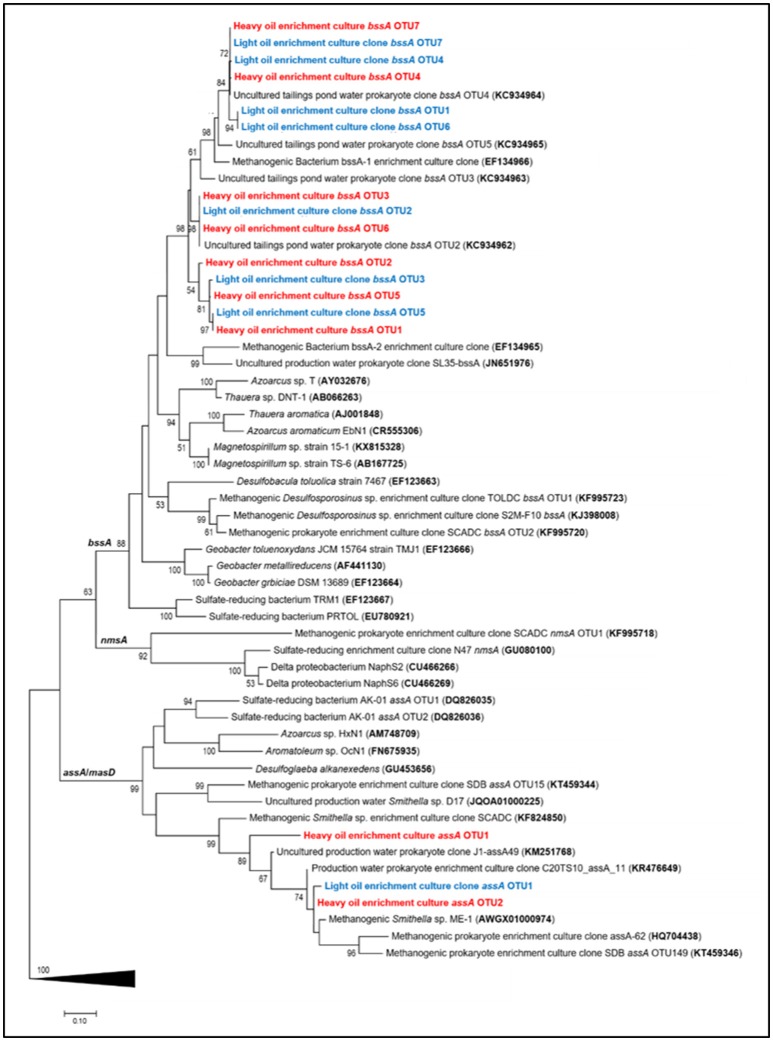
Figure 4.
Maximum likelihood tree showing the affiliation of recovered assA and bssA gene fragments (this study, light oil in blue and heavy oil in red) with previously published reference strains, enrichment cultures, and environmental samples. Evolutionary analyses of aligned nucleotide sequences were conducted in MEGA7 (Kumar et al., 2016); the consensus tree was constructed using the Tamura–Nei model (Tamura and Masatoshi, 1993) at all nucleotide positions (for a total of 481 positions in the final dataset) and performing 500 bootstrap replicates (values below 50% are not shown). Pyruvate formate lyase (pfl) sequences were used as an outgroup (collapsed in figure).

