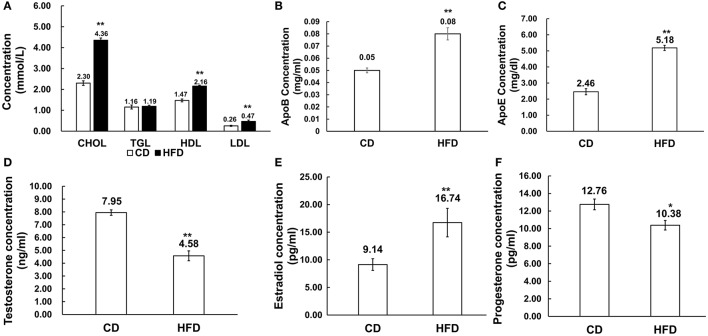
Figure 2.
Alteration of serum lipid and sex hormone level profiles in HFD mice. (A) Comparison of serum lipid level profiles in CD and HFD groups; CHOL: total cholesterol, TGL, triglycerides; HDL, high density lipoprotein; LDL, low density lipoprotein. (B,C) Comparison of ApoB and ApoE profiles in CD and HFD mice. (D–F) Comparison of serum sex hormone profiles between CD and HFD groups, including testosterone, estradiol and progesterone. *P < 0.05, **P < 0.01.

