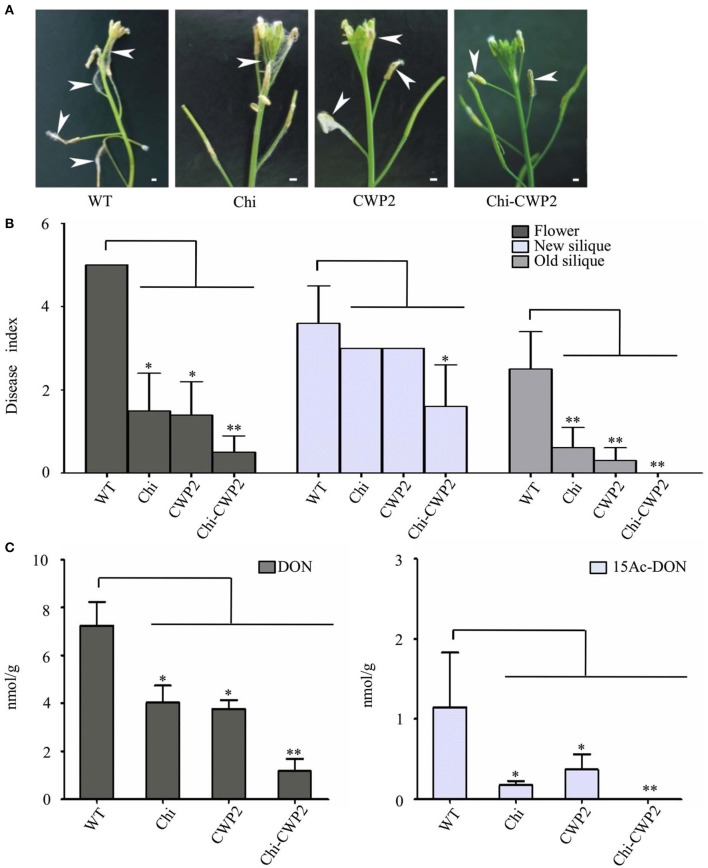
Figure 1.
Phenotypes and mycotoxin production of A. thaliana on day-7 after FG inoculation. (A) Macroscopic features for floral tissue of A. thaliana (bar:1 mm); (B) disease indices and (C) levels of mycotoxins in floral tissues of wild-type (WT) and transgenic A. thaliana expressing Chi, CWP2 and Chi-CWP2 (SD from n = 30, *p < 0.05, **p < 0.01 in comparison with WT plants).

